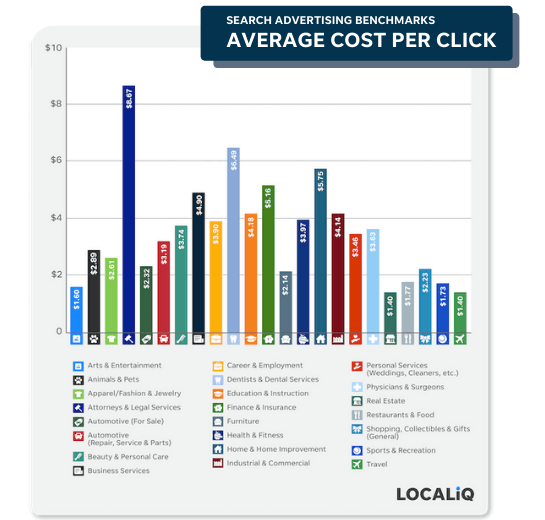
Fill out the contact form and one of our strategists will reach out to you shortly.
Thank you for contacting us.
One of our specialists will soon reach out to you.
SEO and the Student Journey: From Awareness to Enrollment
Imagine yourself at a crossroads. You’re staring down the exciting, yet daunting, path of higher education. Questions swirl in your mind: “What career path should I take?”, “What type of degree is right for me?”, and most importantly, “Which college will help me achieve my goals?”. This is the beginning of the student journey, a crucial decision-making process that every aspiring student embarks on.
Interestingly, this journey often starts with a simple search on Google. Whether it’s “best colleges for engineering” or “tips for choosing a major,” students are actively seeking information online to guide their decisions. This is where Search Engine Optimization (SEO) for Higher Education comes into play.
SEO is the art and science of making your website visible in search engine results. But for higher education institutions, it’s much more than just ranking high. It’s about influencing the student journey at every stage, from initial awareness to final enrollment. So, let’s unpack this journey and see how SEO can be your guide along the way.
Stage 1: Planting the Seed – The Awareness Stage
The first step in the student journey is awareness. Students are just beginning to explore their options, and their minds are brimming with questions. They might be unsure about their desired field, the type of degree they need, or even the very concept of college life.
As a higher education institution, SEO can help you be there at the right time with the right information. This is achieved through keyword research and content creation. By identifying the keywords students are searching for (e.g., “best colleges for social work”, “what does a computer science degree entail?”), you can create informative blog posts, articles, and guides that address their concerns and answer their questions.
Imagine this: A student unsure about their major stumbles upon your article titled “5 Tips for Choosing the Right College Major.” This article, optimized with relevant keywords like “choosing a college major”, “career paths”, and “finding your passion”, guides them through the decision-making process, potentially sparking their interest in your programs.
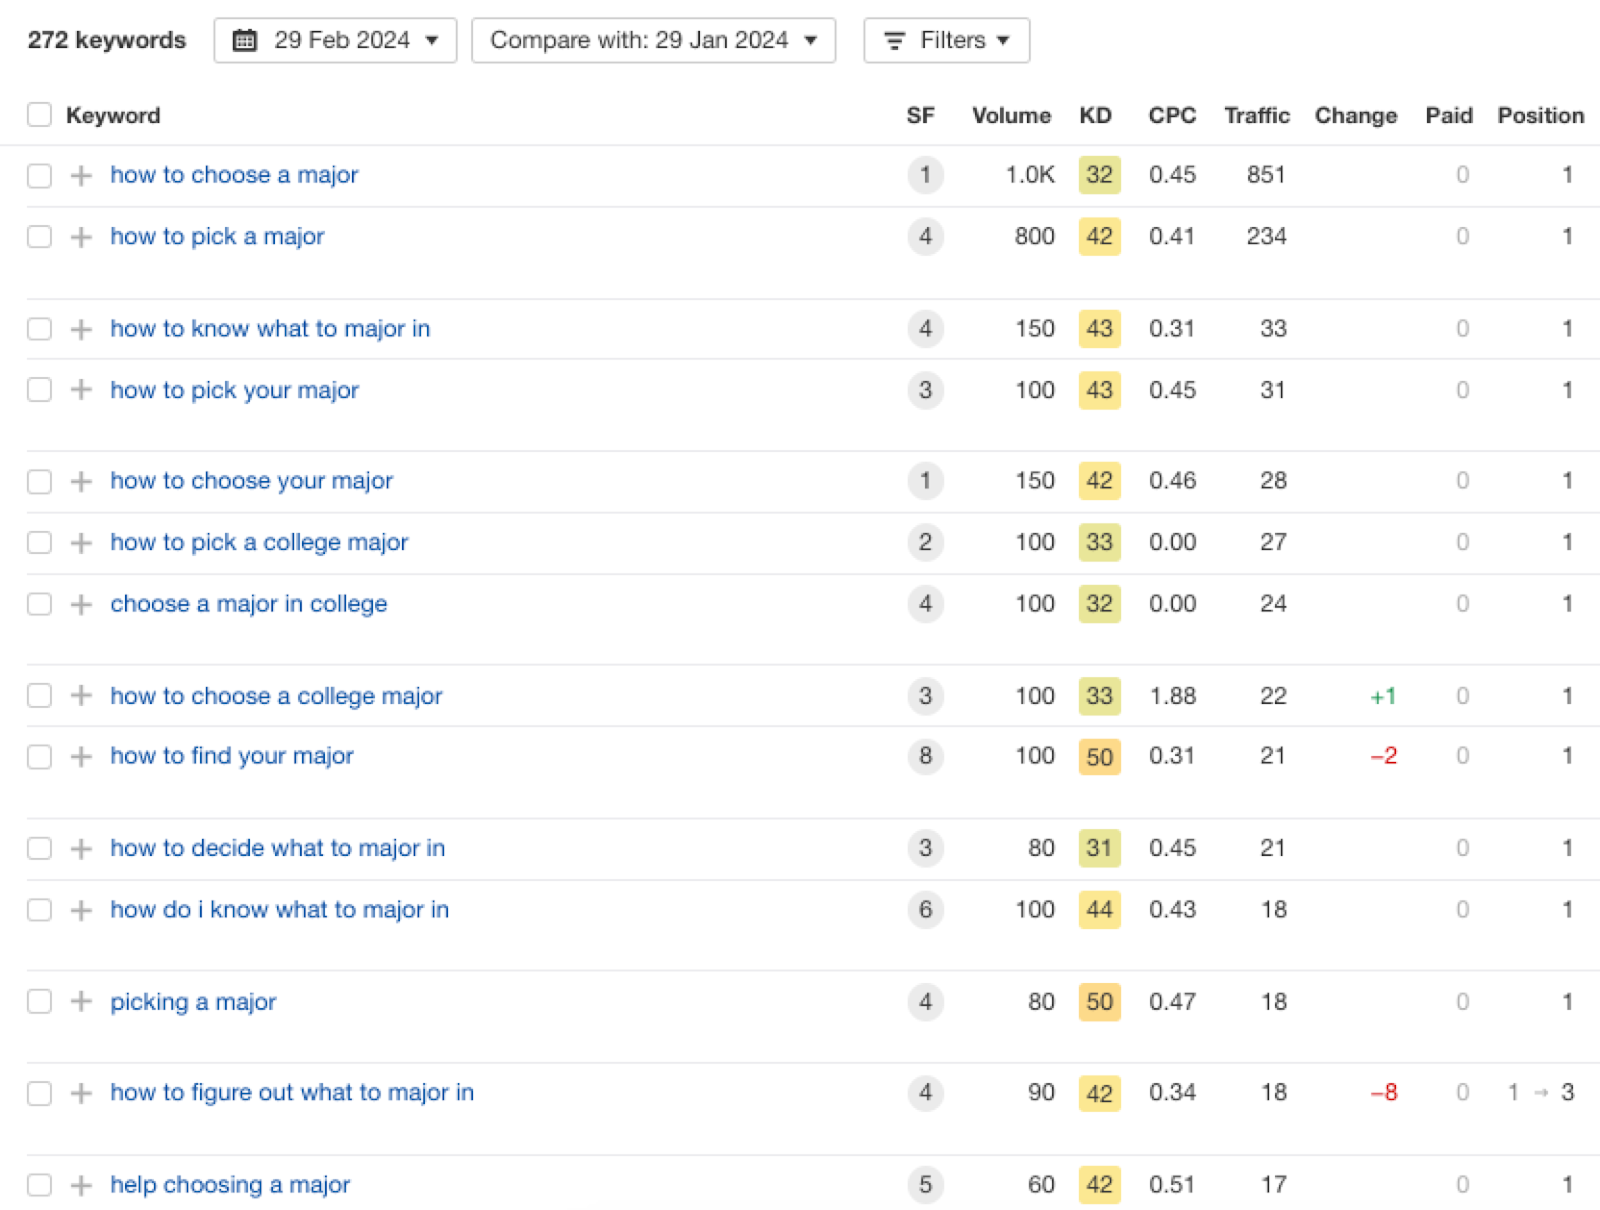
This is exactly what The University of Kansas has done. Their article “10 Tips for Choosing a Major in College” gets close to 2,000 clicks/mo and ranks in the top positions for keywords like:
how to choose a major – 1,000 searches/mo
how to pick a major – 800 searches/mo
how to know what to major in – 150 searches/mo
and hundreds of other keywords
From this research, they might become interested in getting a computer science degree. However, they want to learn more about the program and what they can do with a computer science degree. So they would search for [what do you learn in computer science]. SNHU has an article on this topic (What Can You Do With a Computer Science Degree?), and that page alone brings them over 1,800 clicks every month.
Stage 2: Narrowing the Options – The Consideration Stage
Once students have a better understanding of their interests and goals, they move into the consideration stage. This is where they start researching specific colleges and programs, learning more about things like curriculum, faculty expertise, and even campus life.
In this phase, SEO becomes even more critical. You can create content with relevant keywords related to specific programs and majors (e.g., “computer science vs computer engineering”, “is computer science a good major”). Additionally, ensure your website is user-friendly and provides clear information about programs, faculty profiles, and student life. This makes it easier for students to find the information they need and assess if your institution aligns with their aspirations.
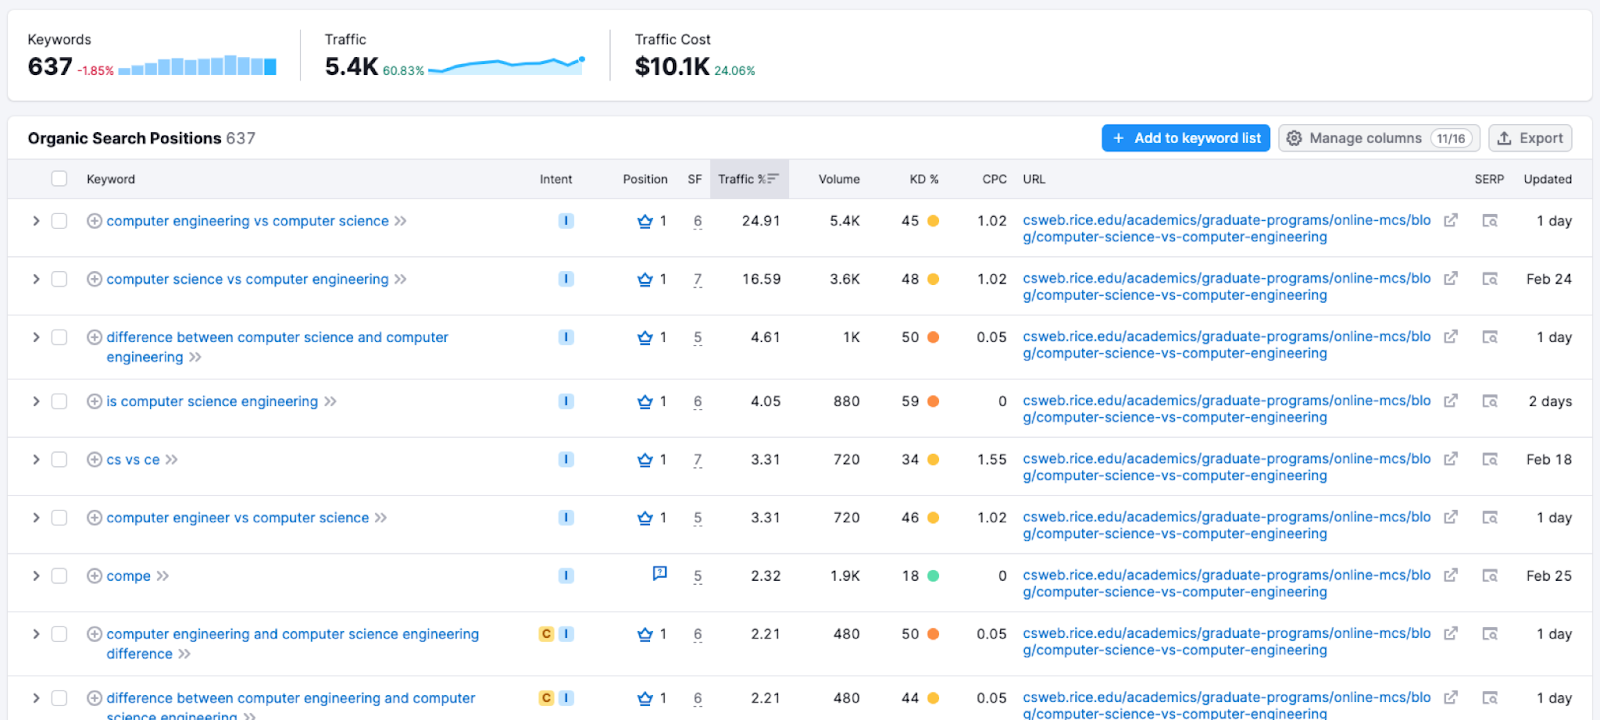
By appearing in search results, this article reaches students with initial program interest but may not be ready for immediate action. This visibility benefits Rice’s brand; every year, tens of thousands of prospective students land on this page, with a significant number engaging with their calls to action and learning more about Rice’s Computer Science program.
Think of it this way: A student interested in computer science lands on your website’s “Computer Science” blog article. The page is optimized with relevant keywords and offers a clear overview of the program, including course descriptions, faculty profiles, and internship opportunities. This transparency and ease of access can significantly influence their decision to explore further or even apply.
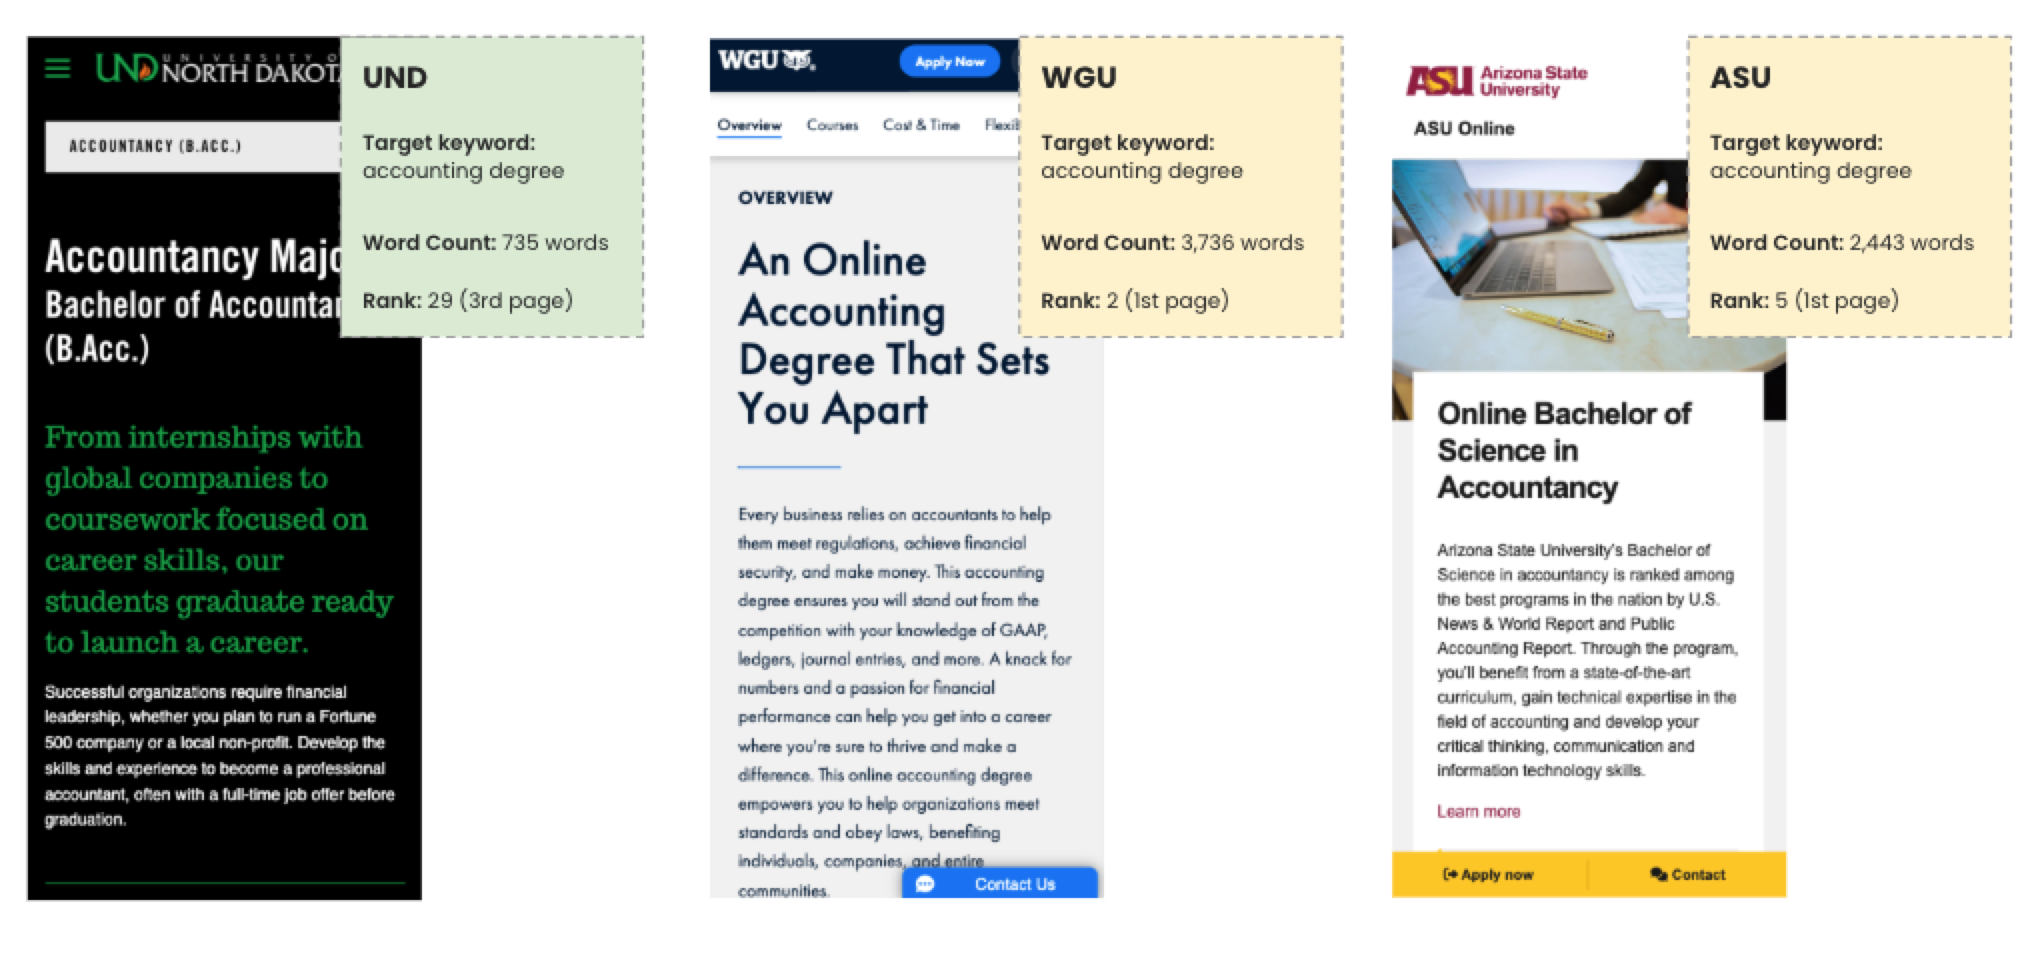
After they’re done with their questions, they are going to search for specific programs. You should be visible here, too, as these searches have a clear intent to convert. They are also one of the most competitive keywords to rank for.
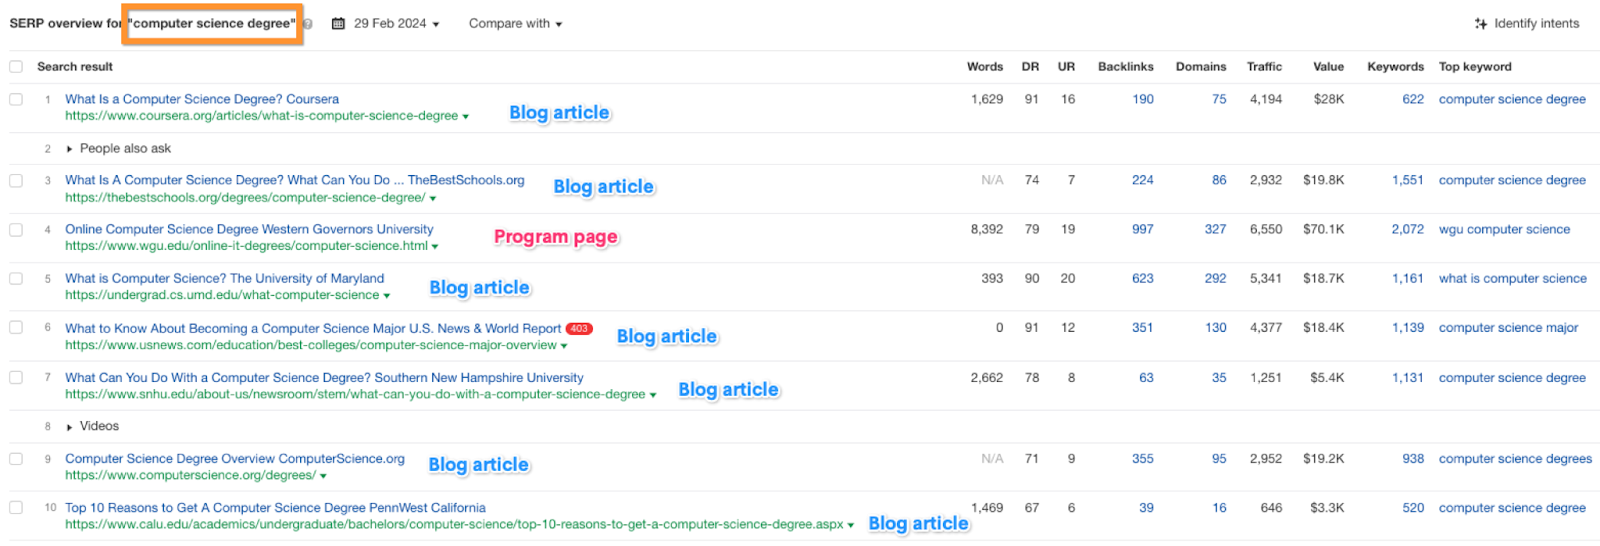
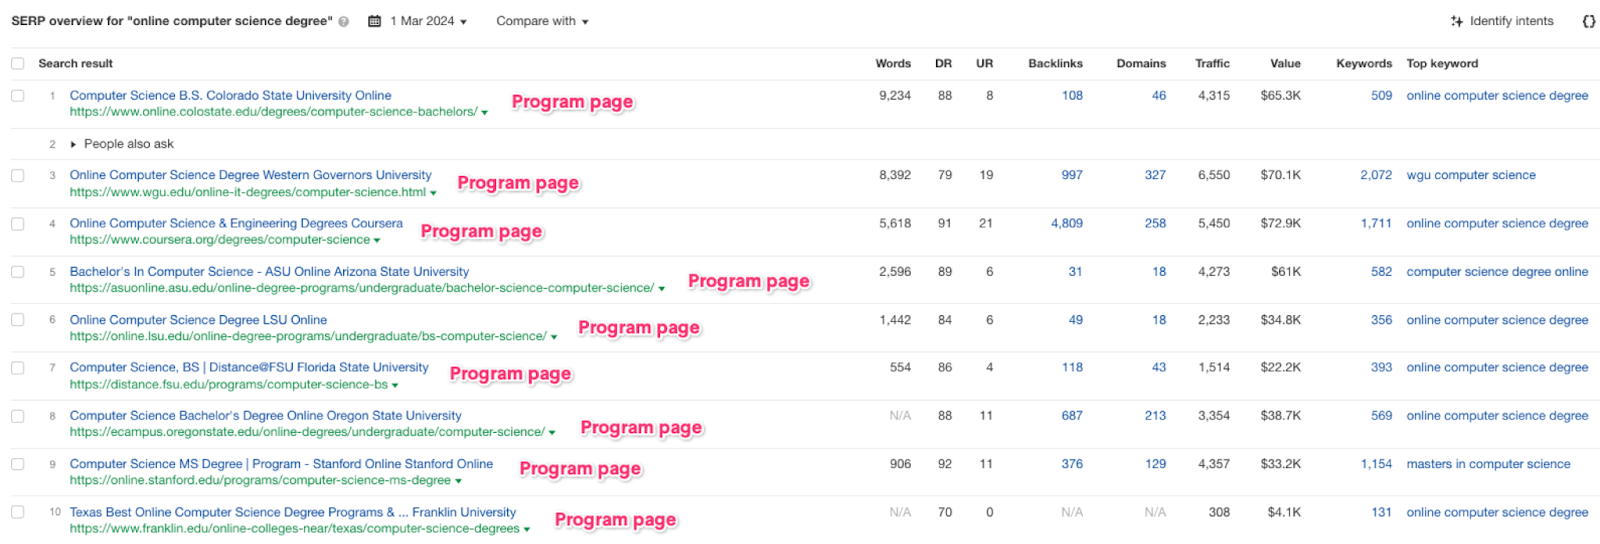
The most important thing to remember here is to understand the search intent and use that information to target the right keywords for your program page. You’d think that targeting the (computer science degree) keyword with your program page is the right decision, but the screenshot below proves you wrong. There’s only one program page ranking for this keyword, all other results are informational content (blog articles).
If you want to rank for this keyword, the best chance you’ll have at ranking will be through blog content that targets this keyword. And for the program page, you’d probably want to target a different version of this keyword that shows more program pages listed.
Here’s one example of search results showing only program pages when you search for (online computer science degree), a keyword that is searched over 9,000 times every month. Because the search query is more specific, this signals Google that the user is interested in programs and not blog articles.
Stage 3: Making the Final Choice – The Decision Stage
The decision stage is where students finalize their choices, considering factors like financial aid options, campus visits, and acceptance rates. As an institution, you want to ensure you’re providing the information and resources that make your option stand out.
SEO can help you showcase the unique selling points of your institution during this crucial stage. You can highlight testimonials from current students and alumni, emphasizing their positive experiences and career successes. Additionally, you can create landing pages dedicated to financial aid information and the application process, making it easy for students to navigate the next steps.
For example, imagine a student on the fence, torn between two colleges. They visit your website and discover a dedicated landing page titled “Scholarships and Financial Aid.” This page clearly explains eligibility requirements, application procedures, and even features success stories of students who received scholarship support. This level of transparency and accessibility can significantly impact their final decision.
Conclusion: The Journey Continues
By understanding the student journey and implementing a strategic SEO approach, higher education institutions can effectively guide prospective students from initial awareness to successful enrollment. Remember, SEO is a continuous process, and it requires ongoing effort to stay ahead of the curve. But by prioritizing relevant content, user experience, and transparency, you can harness the power of SEO to attract the right students and build a thriving academic community.
How SNHU.edu Wins Big With SEO: Strategies You Can Use Today
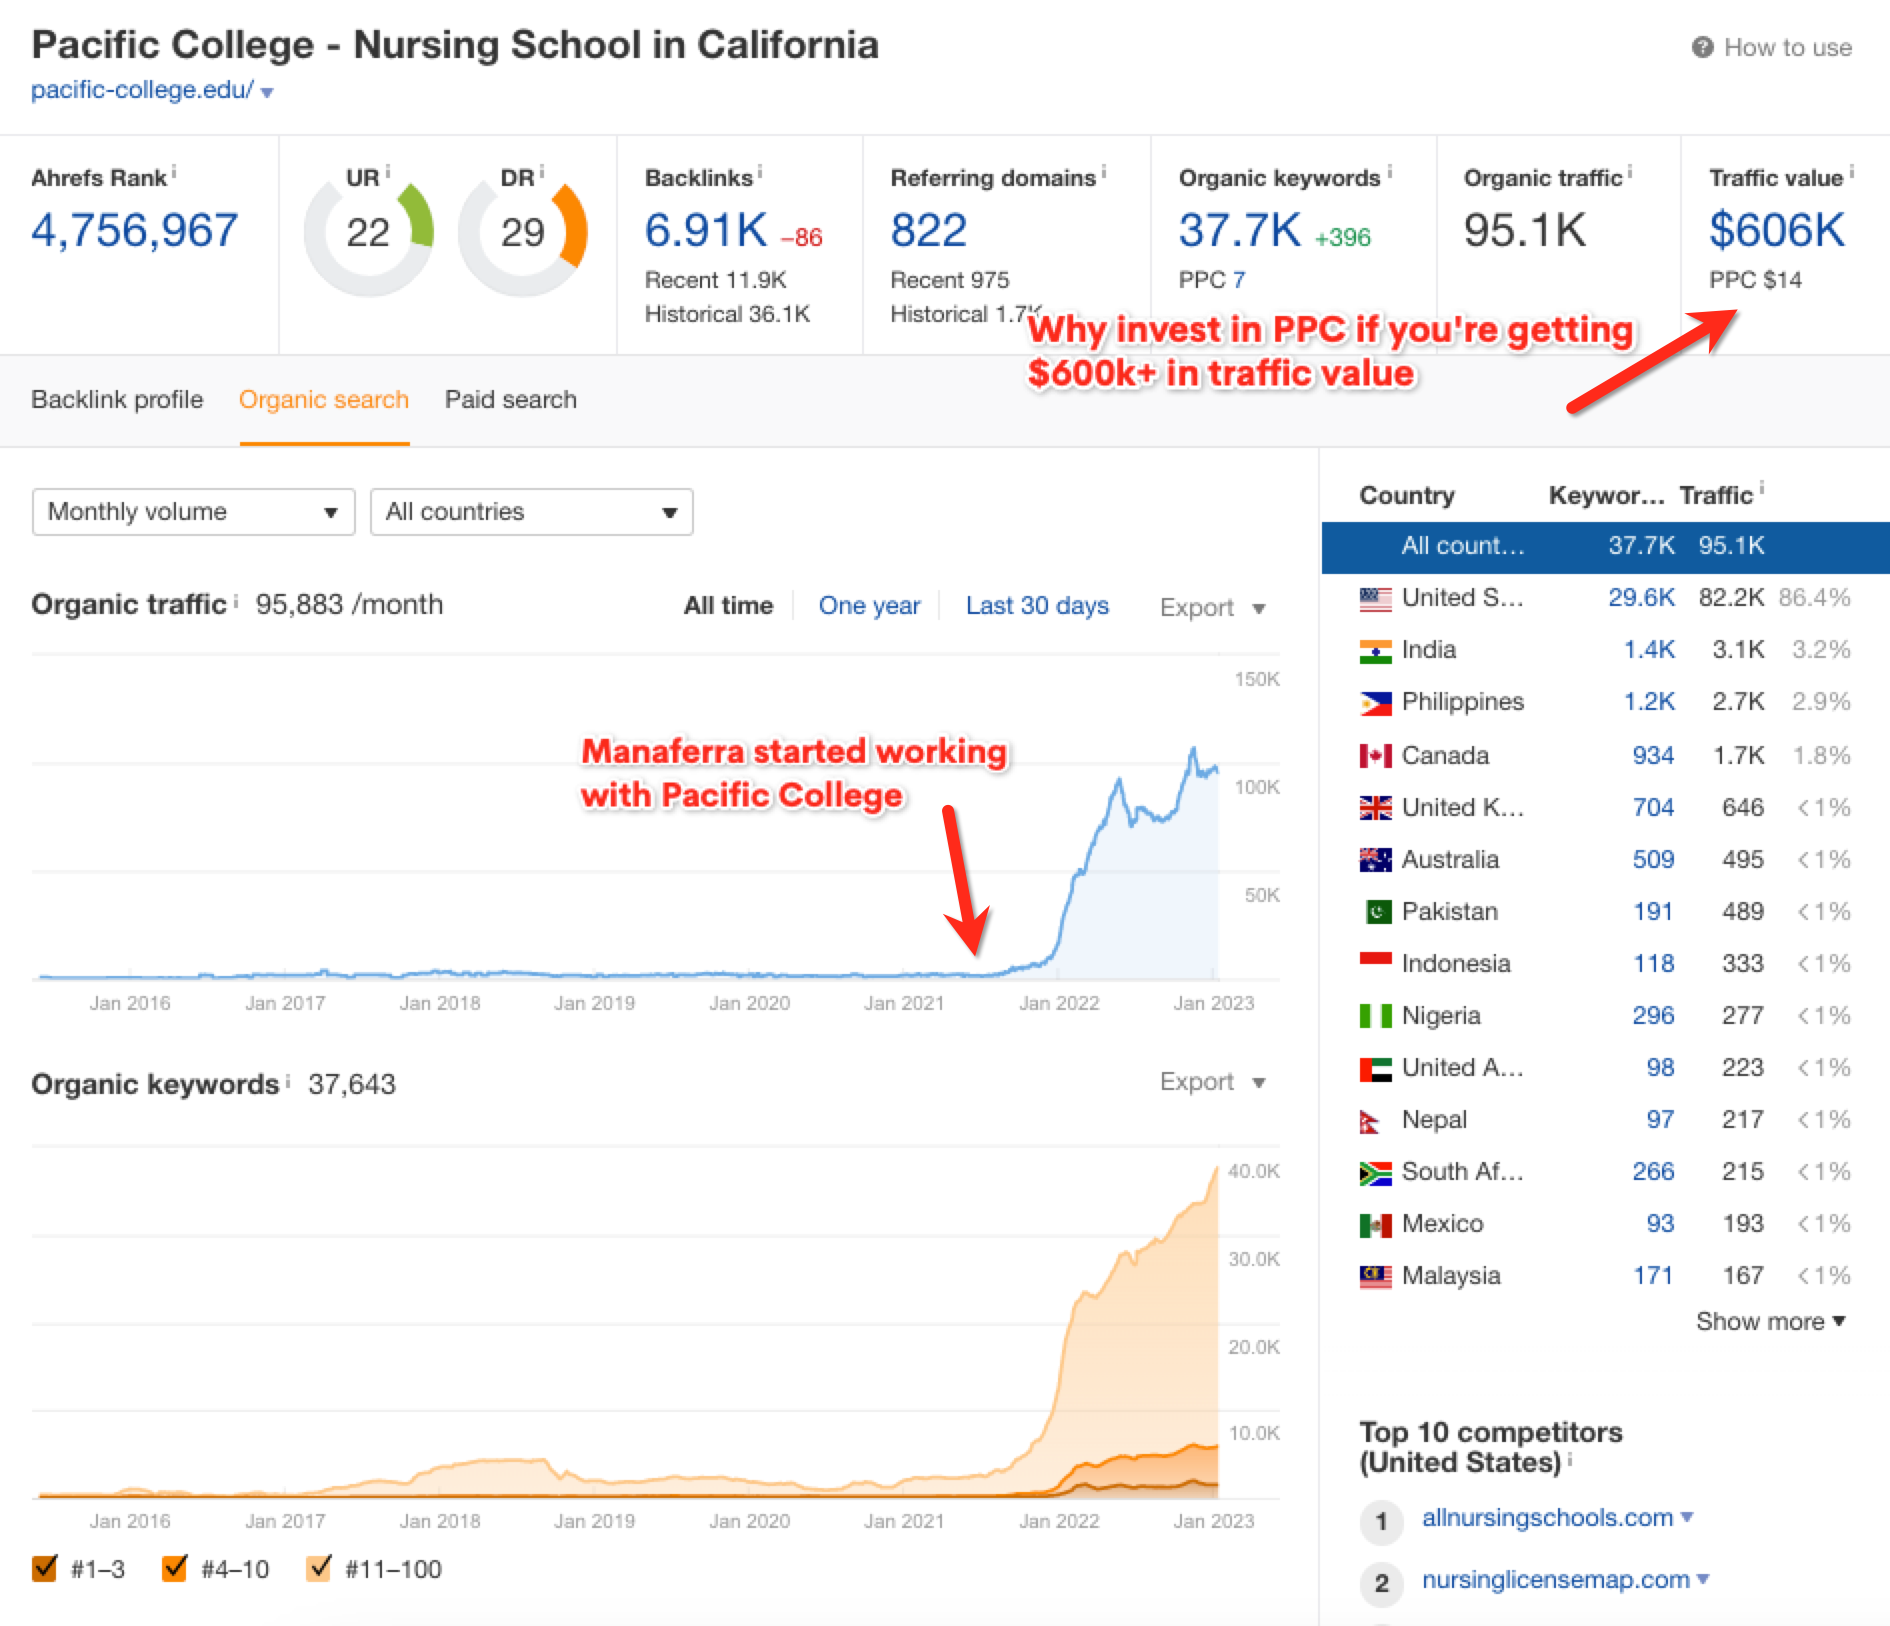
With over 15 million annual visitors solely through organic search, SNHU has cracked the code to SEO mastery. This article peels back the layers of their strategy, revealing the powerhouse tactics behind their online success.
Southern New Hampshire University is a private, nonprofit, accredited institution with more than 3,000 on-campus students and over 170,000 online students, making it one of the fastest-growing universities in the nation. SNHU is not, nor it has been a client of Manaferra in the past. All the data in this article is provided from third-party platforms.
Keep reading to uncover the best practices and actionable strategies that can transform your website into an SEO juggernaut. Apply these proven SEO tactics to your institution’s website and watch your organic traffic soar.
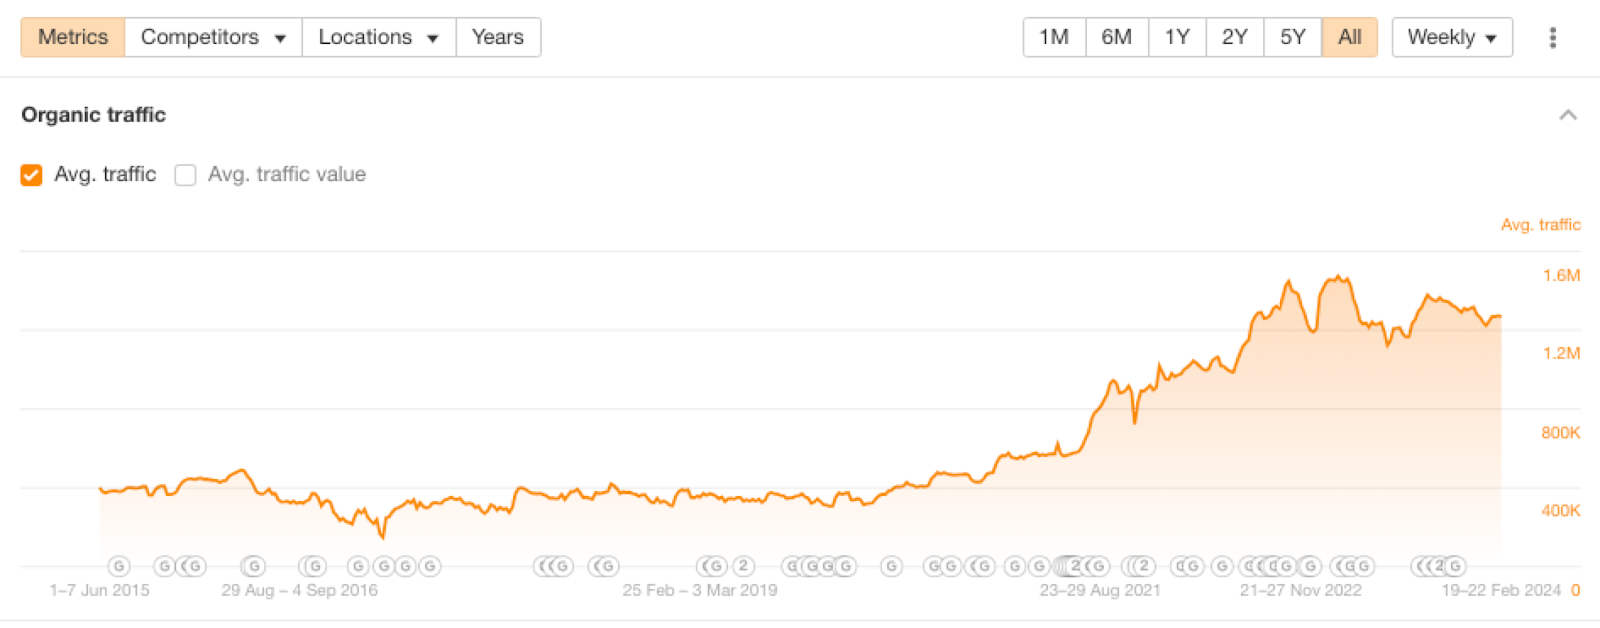
SNHU.edu – Organic Traffic Overview
SNHU.edu gets an estimated 1.3 million visitors from organic traffic monthly. This traffic is only to their “marketing” website (www.snhu.edu) and doesn’t include their mySNHU student website (https://my.snhu.edu), which also receives close to 600k visits from Google every month.
From the Ahrefs traffic chart above, we can see that the traffic started to increase in mid-2020. This makes sense because, during COVID-19, with campuses closed and learning moved online, SNHU was well-positioned to capitalize on this new search demand.
From an SEO point of view, something else that happened during this time was Google giving more weight to all .edu domains in their efforts to combat misinformation. SNHU was already investing in SEO, had all the right pages created to target the right keywords, and when this algorithmic update happened, their pages started to rank better gradually.
The biggest spike in their traffic came from the July 2021 Core Update. Their traffic increased by almost 60%, from 600,000/mo to 950,000/mo.
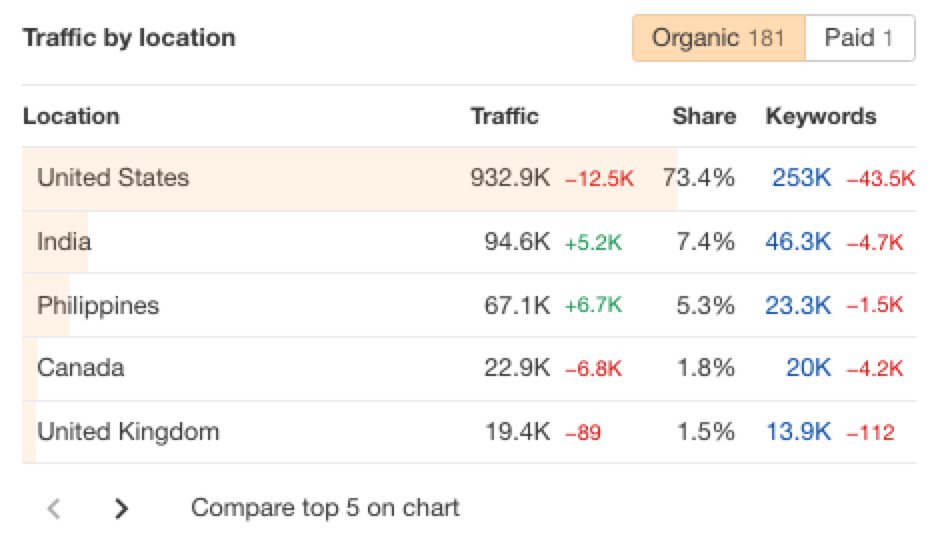
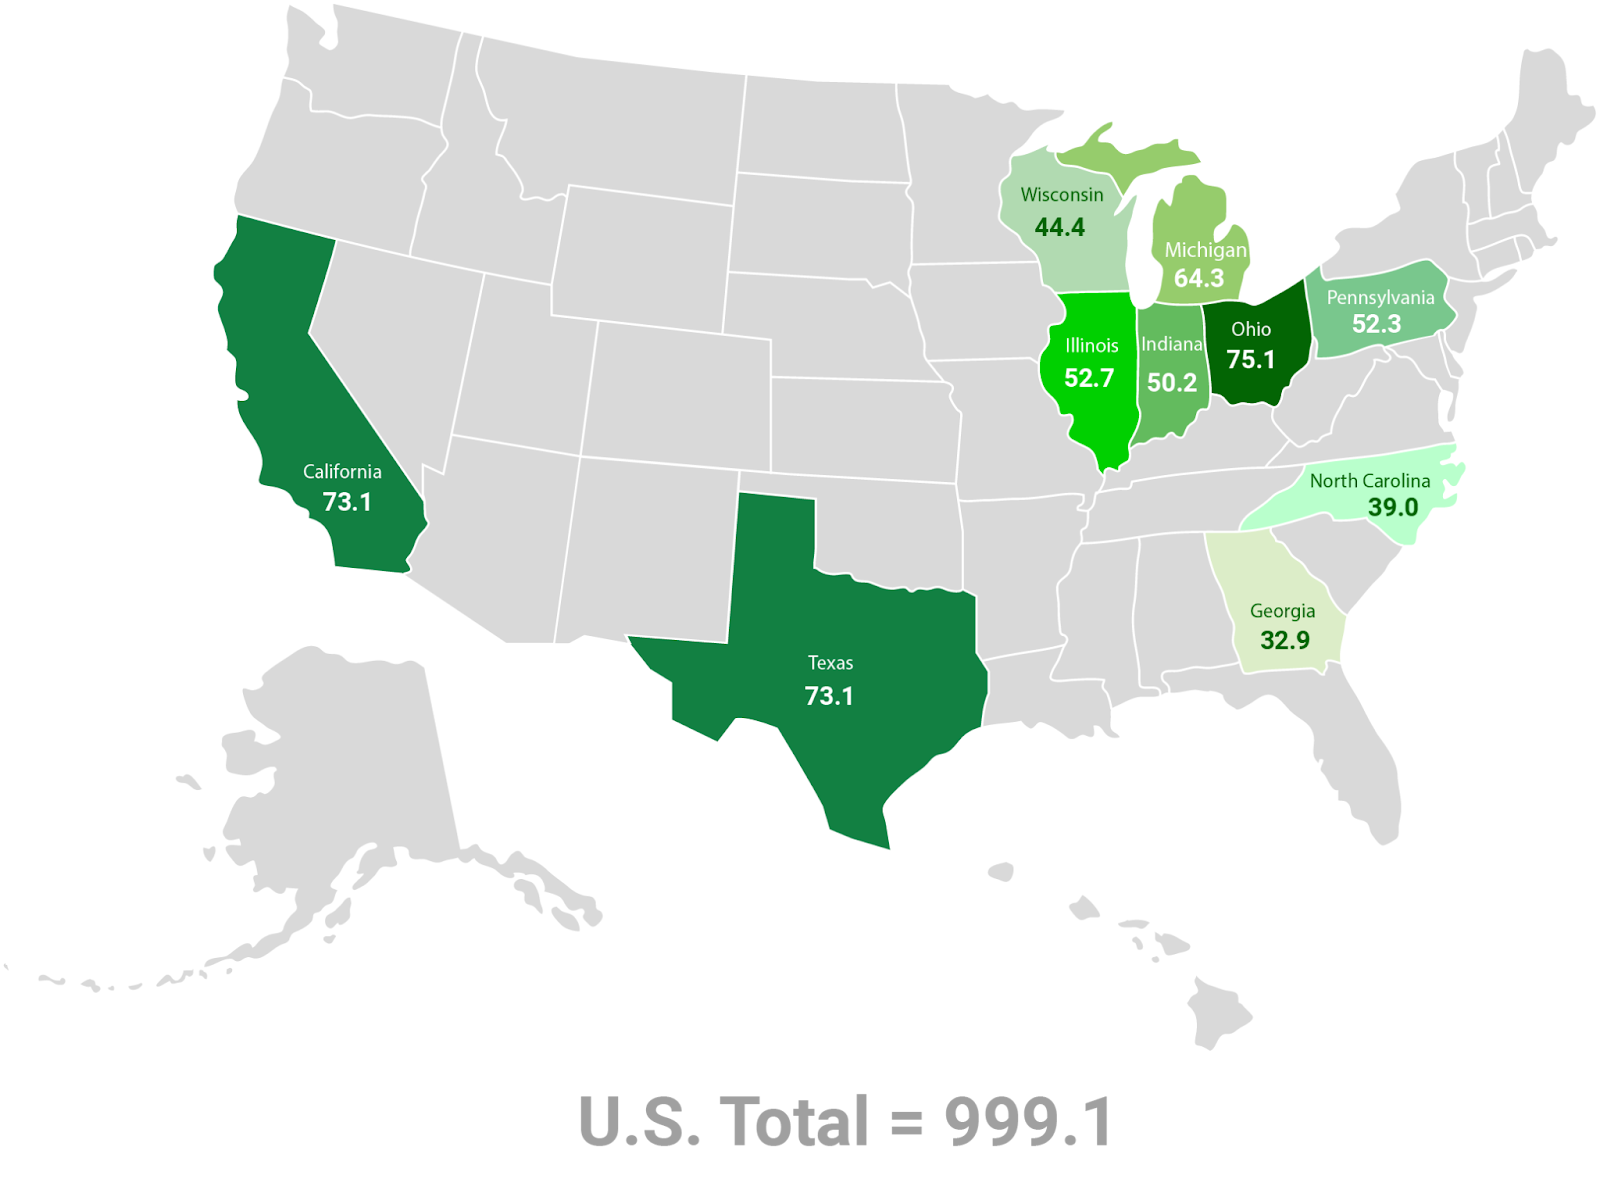
Another interesting data point is to look at their traffic by location. 73.4% of the traffic is coming from the United States, but they’re also getting significant traffic from India and the Philippines. This is normal; some of the content that will be published on the site will perform in markets outside the US as well, even if that is not part of the strategy. In SNHU’s case, this could be intentional since they are targeting international students as well.
Traffic Value
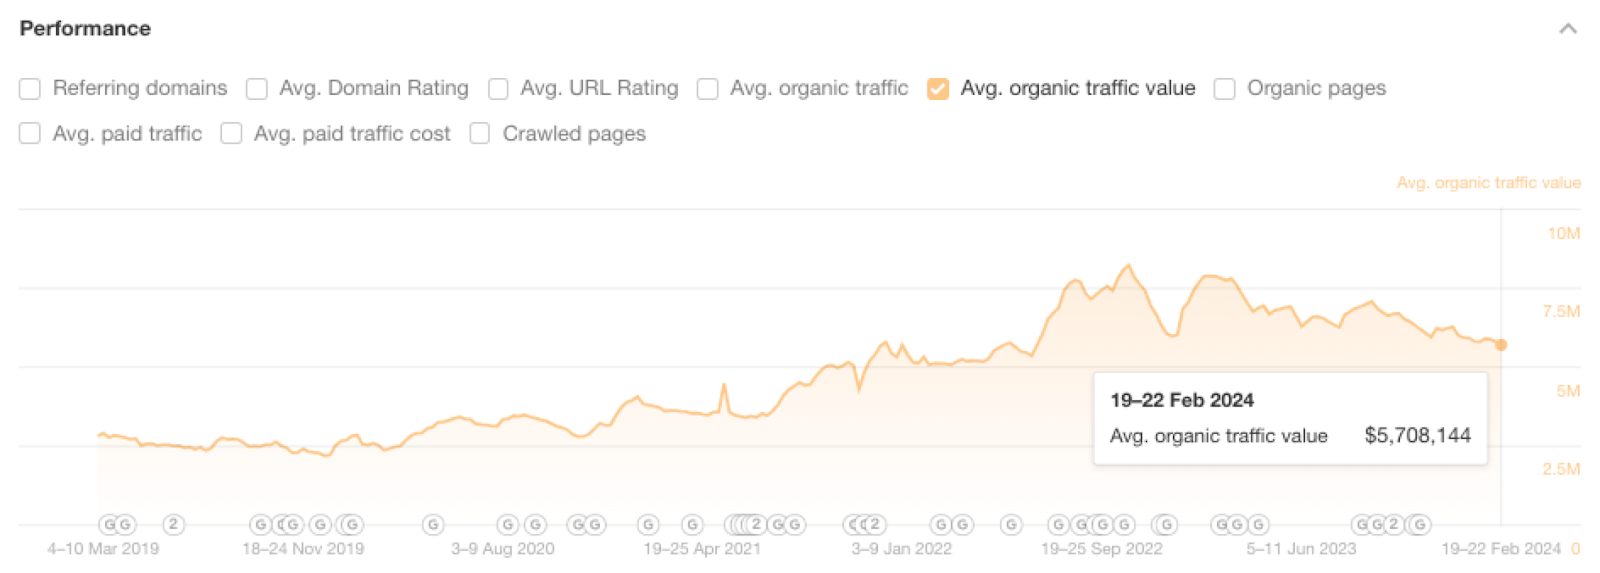
Organic traffic value is the equivalent monthly cost of traffic from all keywords that the SNHU.edu website ranks for organically if that traffic was paid via PPC instead.
Ahrefs calculates it by multiplying the monthly organic traffic of each keyword at its respective ranking position by its CPC value. Then, they add up the organic traffic cost of individual keywords that the target website/URL ranks for.
In essence, the number gives you a sense of how valuable a domain’s keyword profile is. Another way to think of it is how much money SNHU has saved in terms of ranking for keywords organically instead of buying paid traffic.
In their case, SNHU gets over $5.7m in traffic value for free (per month) because they’re ranking for hundreds of thousands of keywords and getting over 1.3m visitors per month.
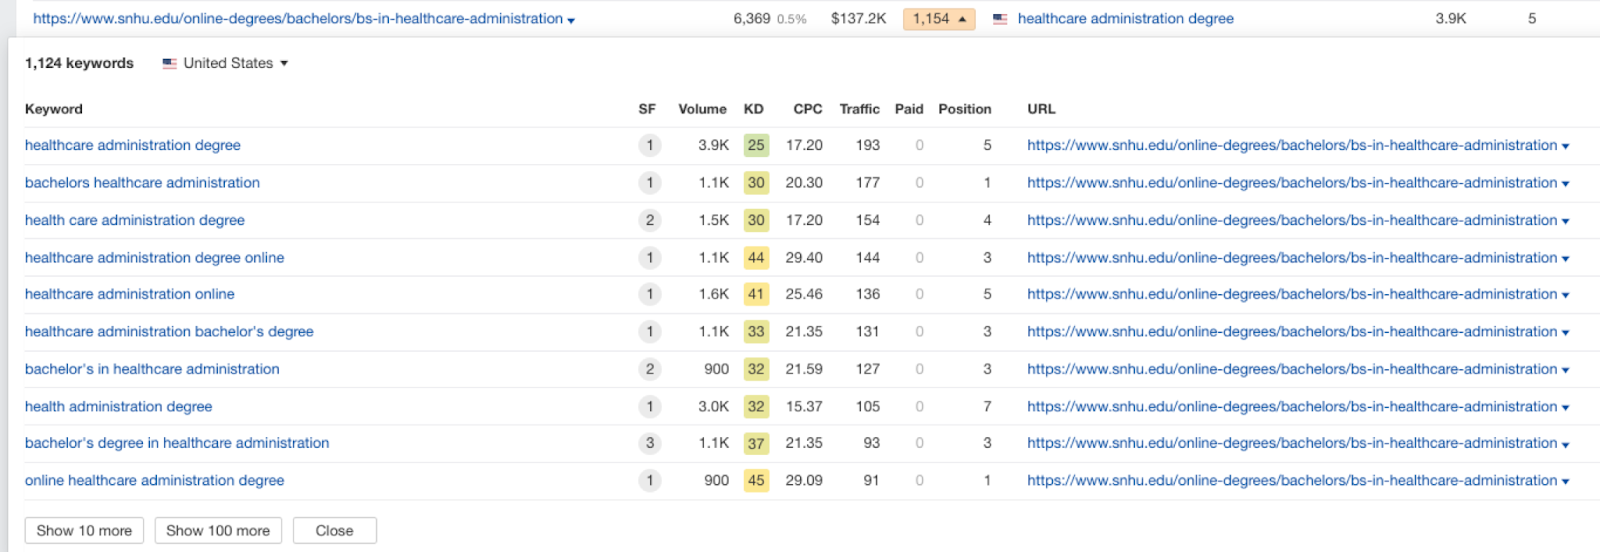
Here’s one example: their healthcare administration degree page gets over 6.3k clicks every month. They are ranking in top positions for keywords like:
healthcare administration degree [3,900 searches per month, position 5]
bachelors in healthcare administration [1,100 searches per month, position 1]
healthcare administration degree online [1,100 searches per month, position 3]
If they had to advertise on Google Ads to get this traffic, it would cost them $137,000; instead, because they have a strong SEO presence, they’re getting this traffic for free.
Branded vs. Non-Branded Organic Traffic
When we filter out the branded keywords, the traffic drops to 1m per month. This tells us that SNHU’s branded traffic is 23.07% of total traffic.
This is really good because, for most higher ed. institutions, the majority of their organic traffic is usually branded traffic.
Branded traffic is usually from people who already know us; this could be existing students, alumni, etc. Branded traffic can also be impacted by offline marketing initiatives, which could drive more people to search for your institution.
In the case of SNHU, they’re getting 76.93% of their traffic every month from people who discover them not by searching their brand but by searching for programs and information they need, and SNHU offers. In SEO, this is the traffic you want to go after; these are new audiences that most likely haven’t engaged with your brand before and are interested in what you have to offer.
Key Insights & Recommendations
Having your main (root) website serve primarily as a marketing asset can do wonders for your SEO. SNHU.edu does this and it’s one of the reasons why their site performs so well in the search results.
You need to know how much of your traffic is branded vs non-branded. The easiest way is to look at your Google Search Console property and to filter out all branded queries and see how this impacts the overall traffic.
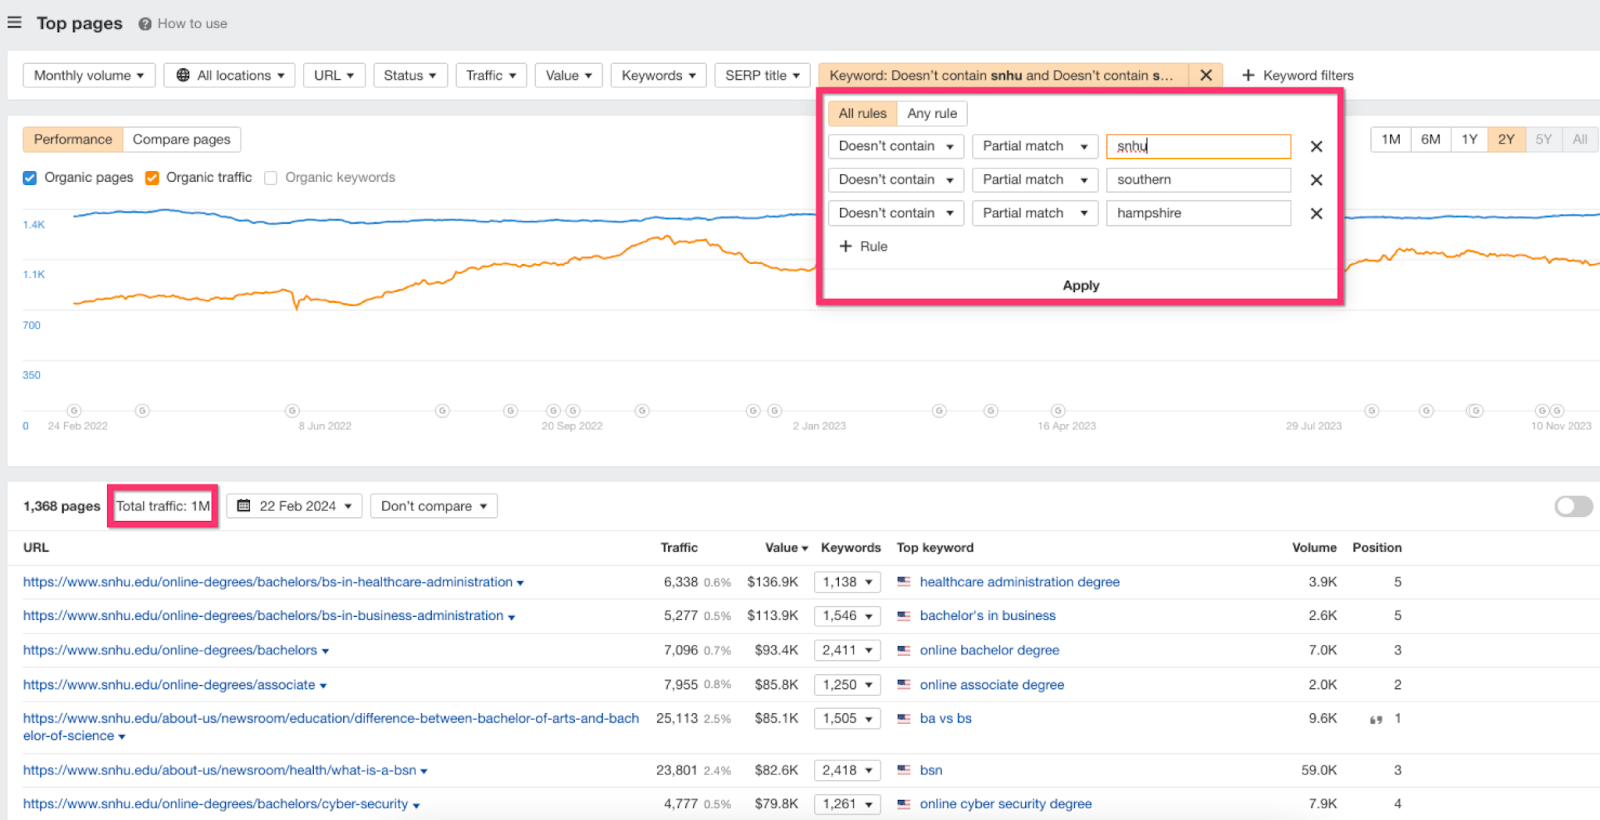
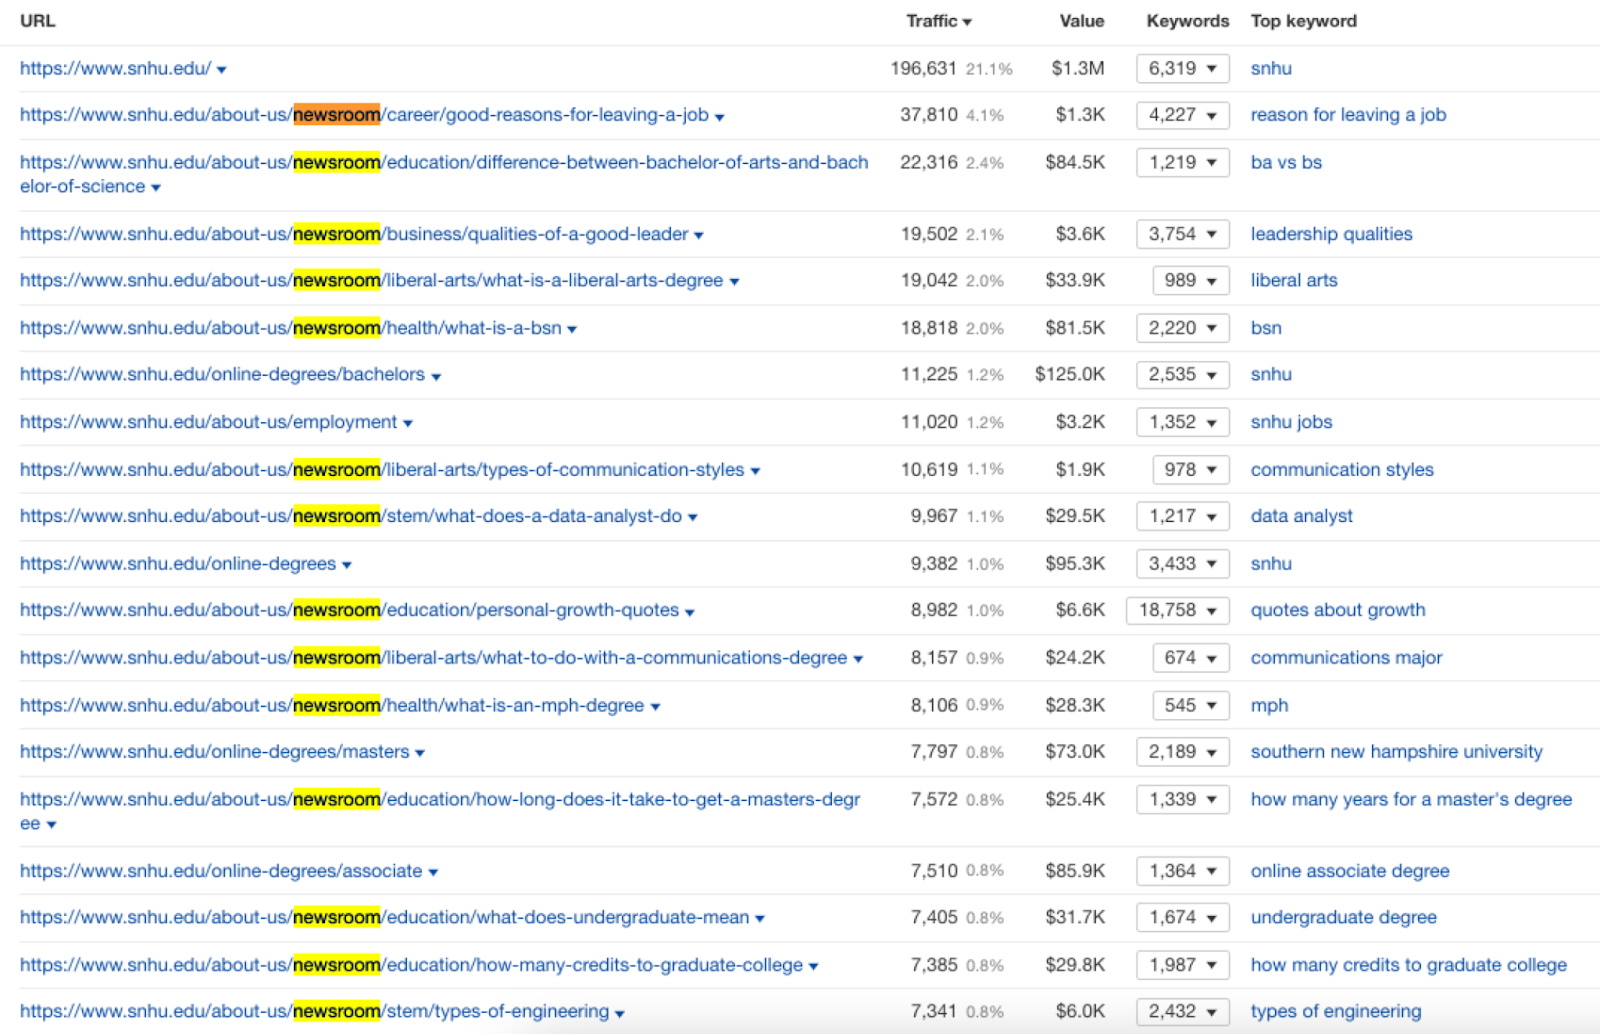
Top Pages (by Organic Traffic)
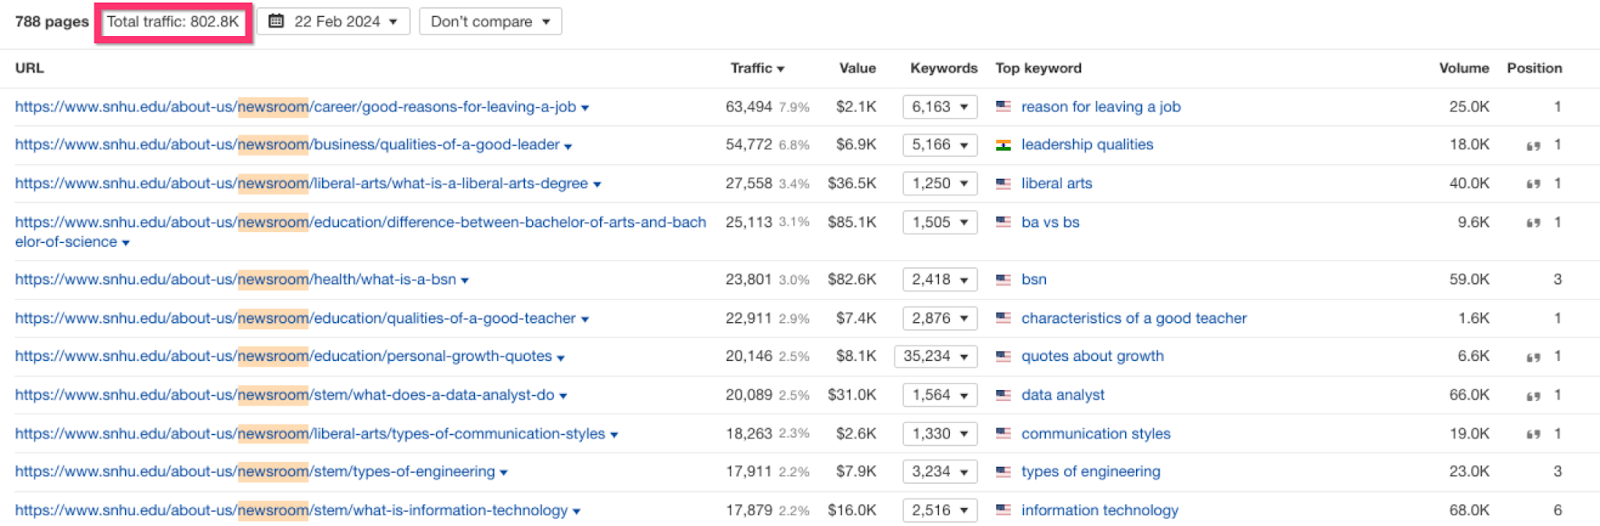
Looking at their top pages by traffic, we notice something interesting: most of the top pages are not program pages but blog articles. This is intentional, and here’s why:
There are two important things here that we need to understand: how students search and the concept of search intent.
How Students Search (the Student Journey in Google)
Our first instinct when thinking about the keywords we’d like to rank for would be to go after program-related keywords. And this is correct. However, we need to understand that there are thousands of other institutions going after the same keywords as well, so the competition is fierce.
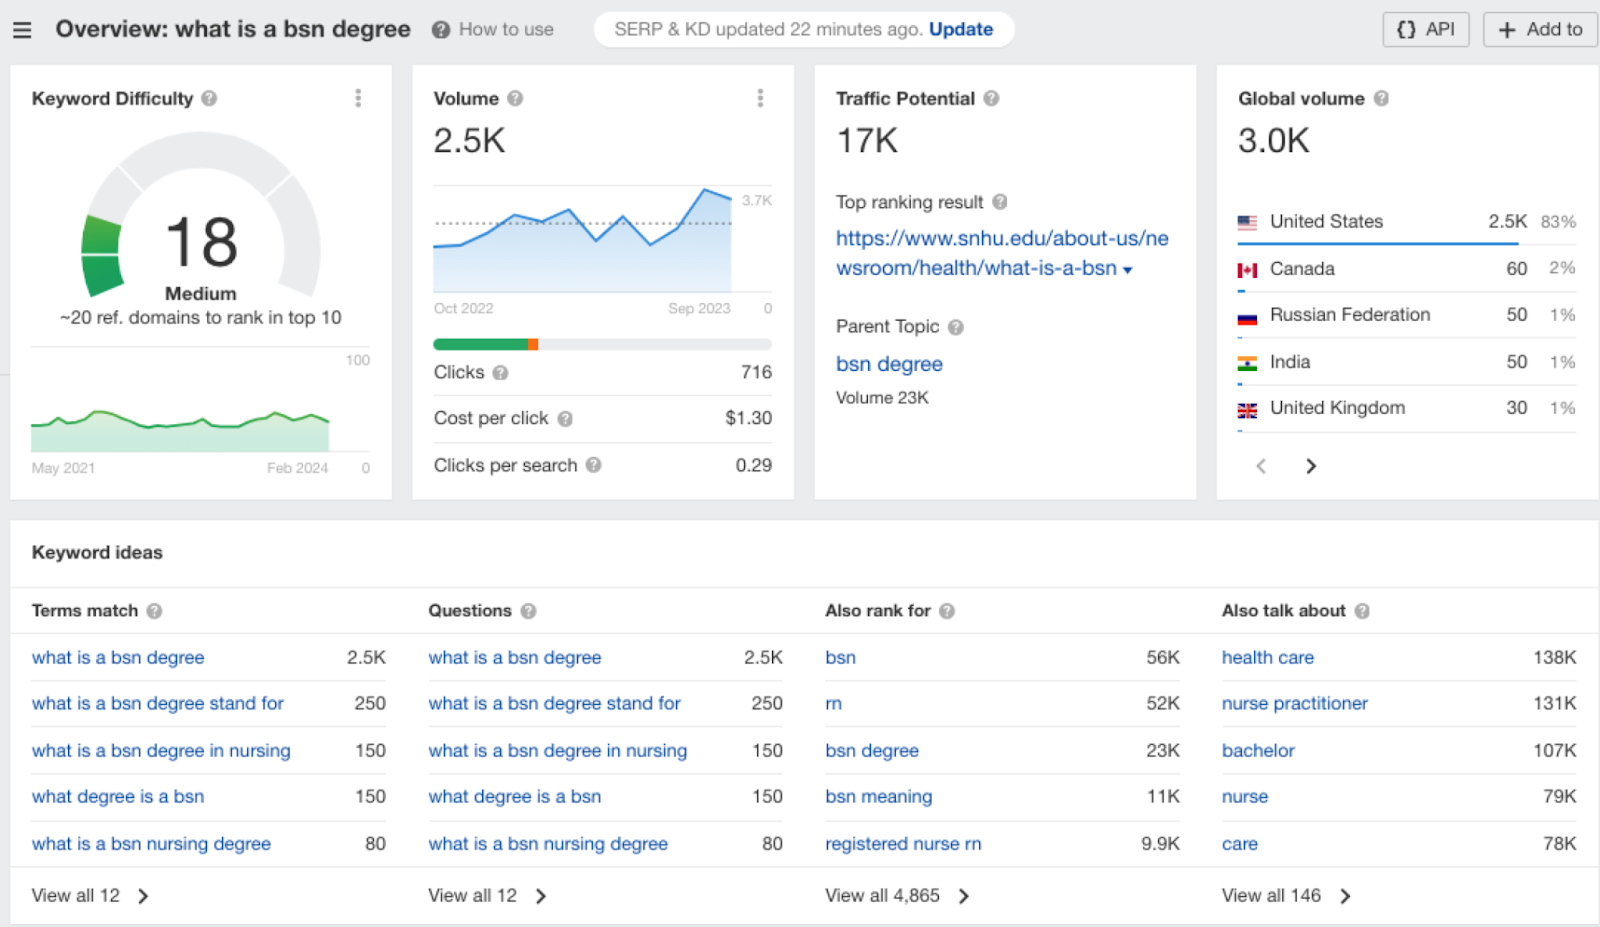
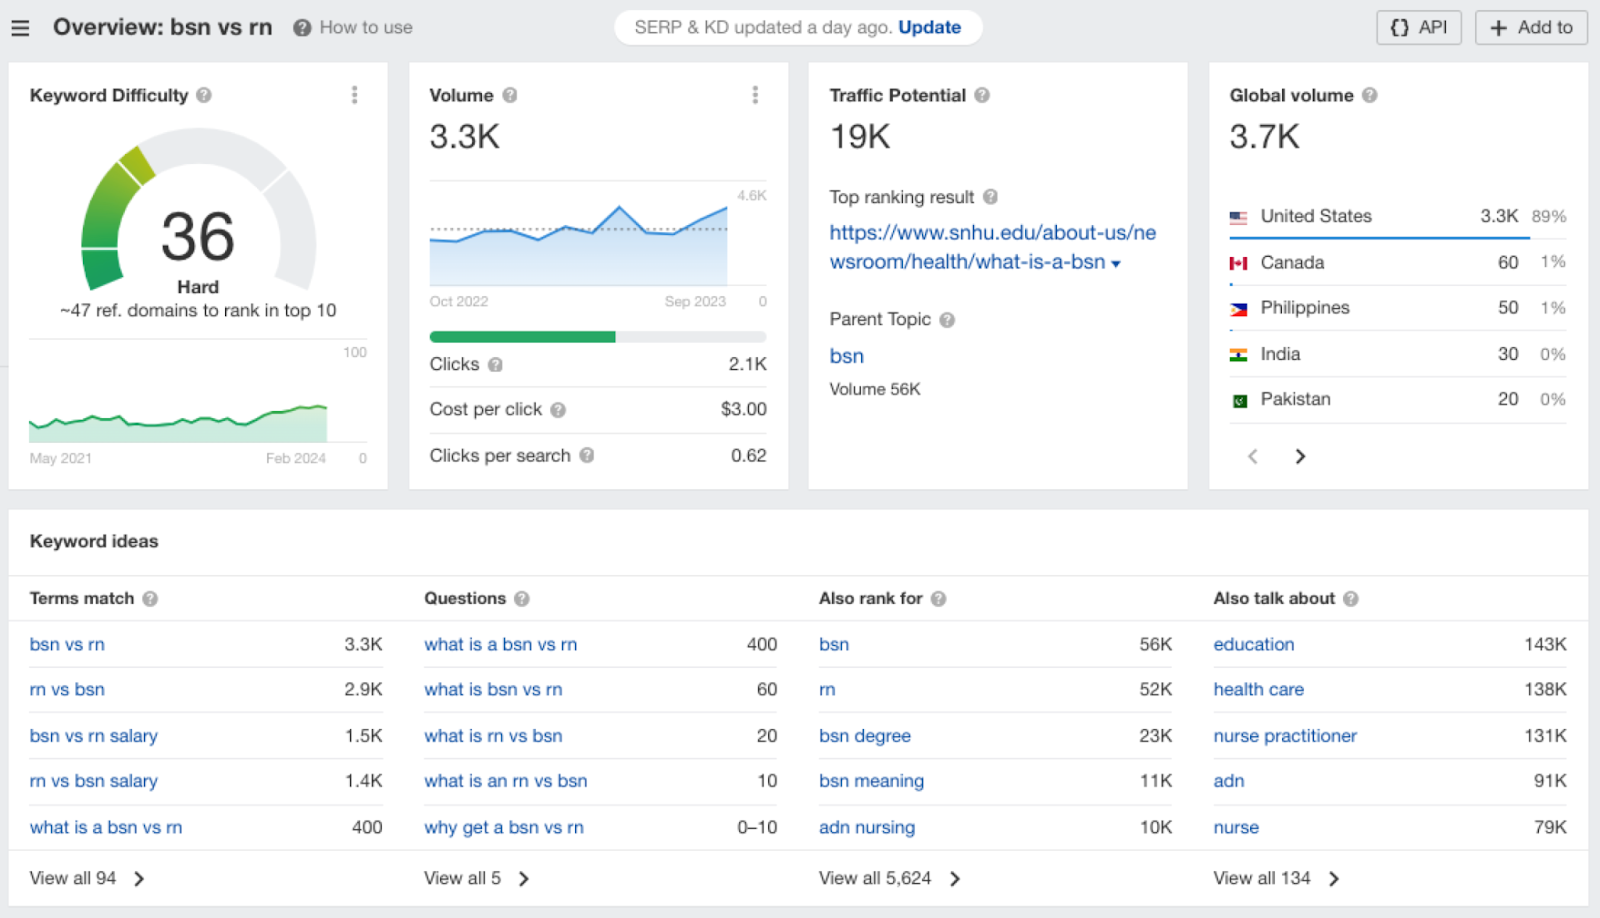
We also neglect the fact that when a student starts considering getting a degree, they don’t immediately search for [master’s in cybersecurity] or [bachelor of social work]. They have questions, tons of them, and very often quite basic questions like [what is a BSN degree].
Once they start to educate themselves, they begin to refine their questions, and would probably search something like [is a BSN degree worth it] or [BSN vs RN].
They have thousands of these questions, and they search for them hundreds of thousands of times every month on Google. SNHU has created a content library that provides answers to these questions, and because their content is quite good, they are able to rank and get in front of them earlier in their student journey.
Chances are that these students will engage with SNHU, request more information about their programs, and remember this positive experience (being educated on their questions) when the time comes to apply.
Search Intent
Search intent is the main goal a user has when typing a query in the search box. This is important for us because, in the Higher Ed. SEO space, it impacts what keywords we target with our program pages, and for what keywords we need to create informational (blog) pages.
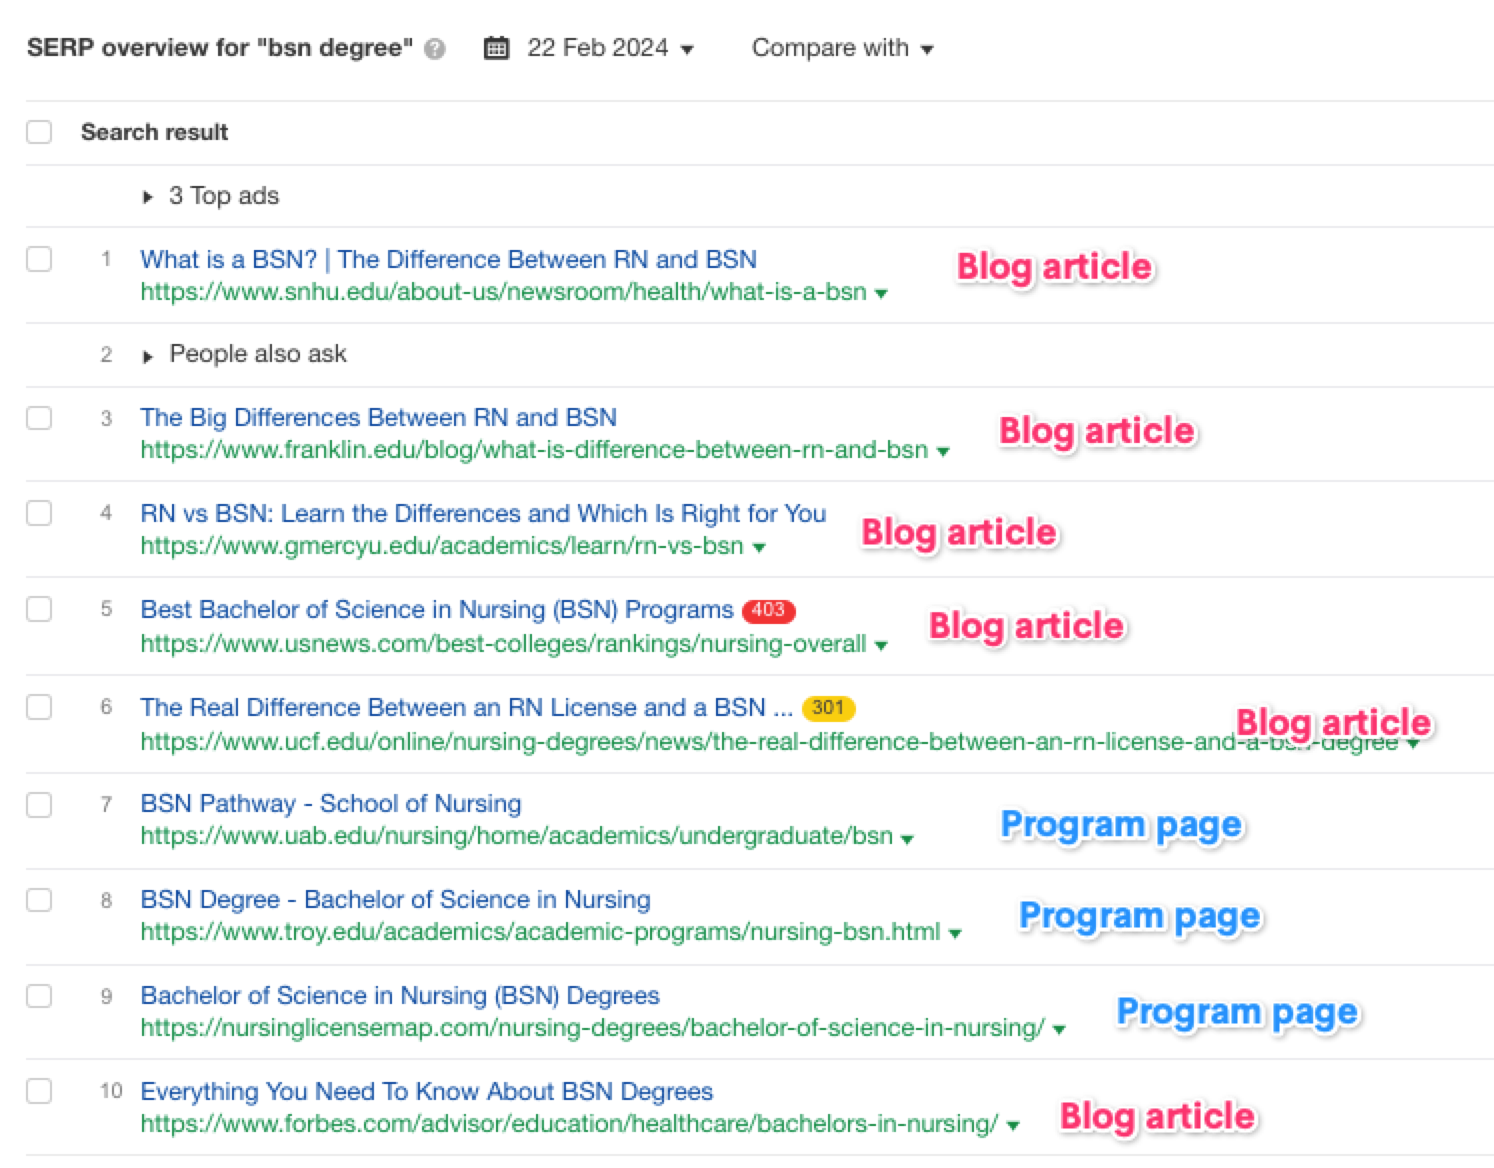
If you search for [BSN degree – 23,000 searches/mo], you might think that Google will show you program pages offered by different institutions.
The reality is that Google will show you mostly blog articles and a few program pages at the bottom of the search results.
Google has determined that the search intent for this keyword is informational – someone searching for it is more likely to look for information about what is a BSN, the difference between RN and BSN, than to go to a program page.
You can repeat the search for keywords like [MBA degree] and [MSW degree], and the results will be similar.
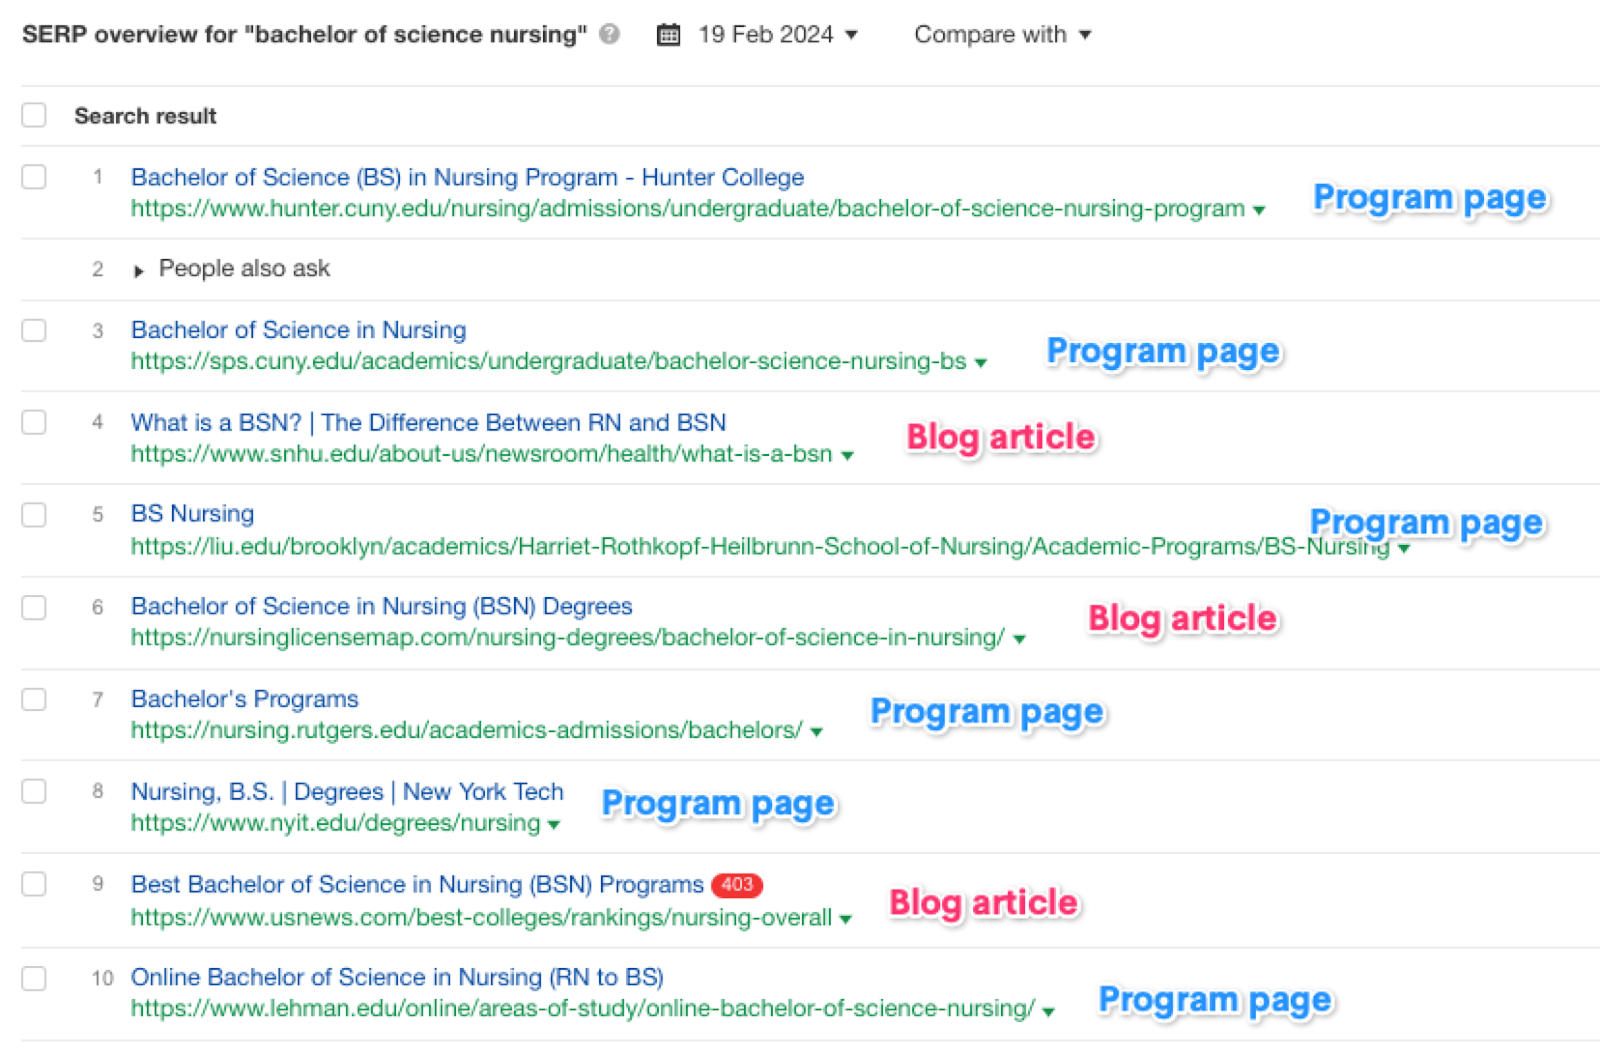
When the query (keyword) is more specific, then Google starts to refine the search results, to better answer the search intent. Here’s what Google shows when you search for [bachelor of science in nursing – 2,900 searches/mo].
This is the reason why content marketing (blog) is an important part of your SEO strategy. It allows you to rank for keywords that your target audience is searching for thousands of times every month. You wouldn’t be able to rank for these highly relevant keywords with a program page, and you also need to keep in mind that there are even more content opportunities out there to rank for by answering students’ questions.
Program Pages vs. Blog Content (Organic Traffic Breakdown)
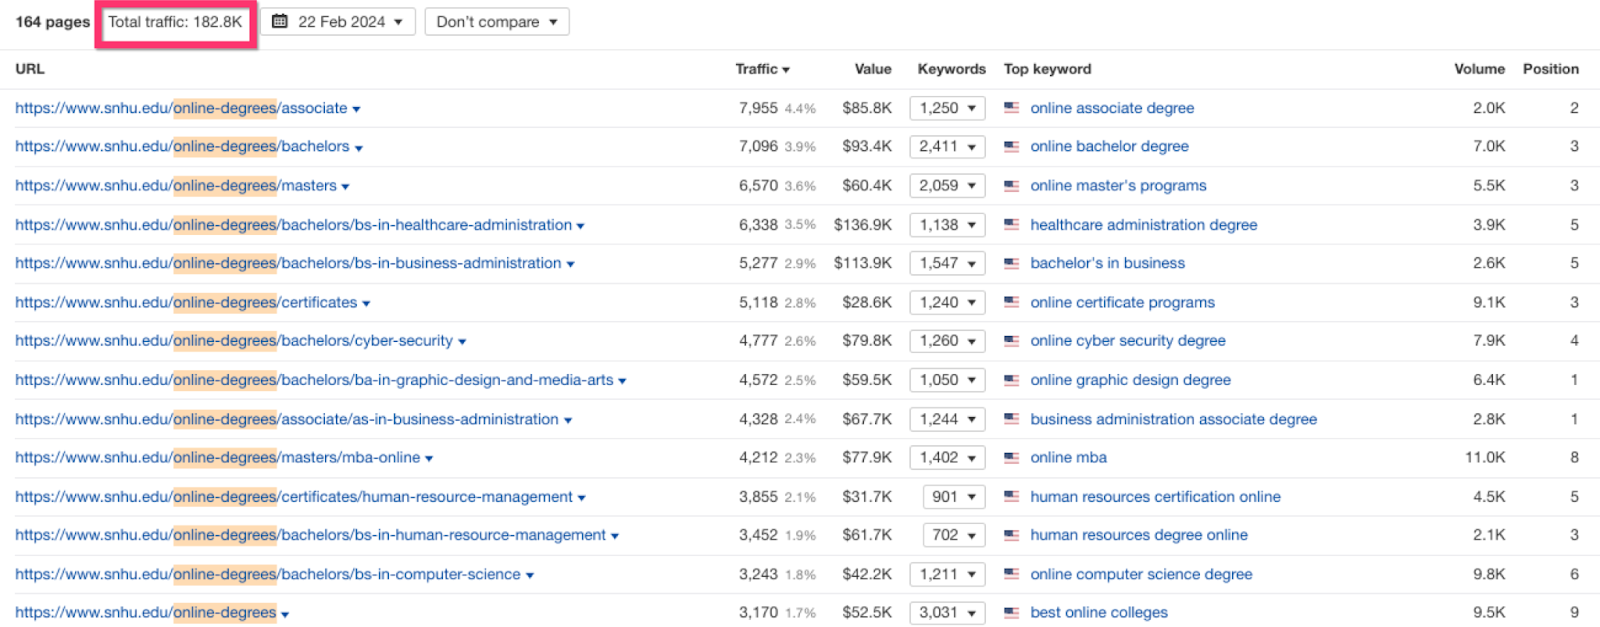
SNHU gets over 182,000 visits to its 164 program pages every month.
The total traffic to their blog is 802,000 per month.
In terms of value, the traffic to their program pages is far more valuable than the traffic to the blog. However, we must note that their blog helps a lot with their program pages to rank and get the traffic they’re getting today. This help comes in the form of building topical authority (another important concept in the SEO world – in short, it means making Google see you as a thought leader in the space because you’ve published content on the topic that is relevant to your program page), internal linking from the blog articles, and backlinks (authority) built organically.
Key Insights & Recommendations
If you are targeting specific keywords with your program pages, you want to make sure that you’re targeting the right ones. Google that keyword and if you’re seeing mostly program pages, then the keyword you’ve selected is a good one. If you’re seeing a mix of blog articles, listicles (best degrees type of article), then you might want to reconsider.
Make sure that you have a report that looks into the non-branded organic traffic to your program pages. This is the most important traffic that you can target with your SEO efforts, and you want to make sure the numbers you’re seeing are not impacted by branded searches (i.e. someone searching for your institution name + the program name)
SNHU.edu – Program Page SEO Performance
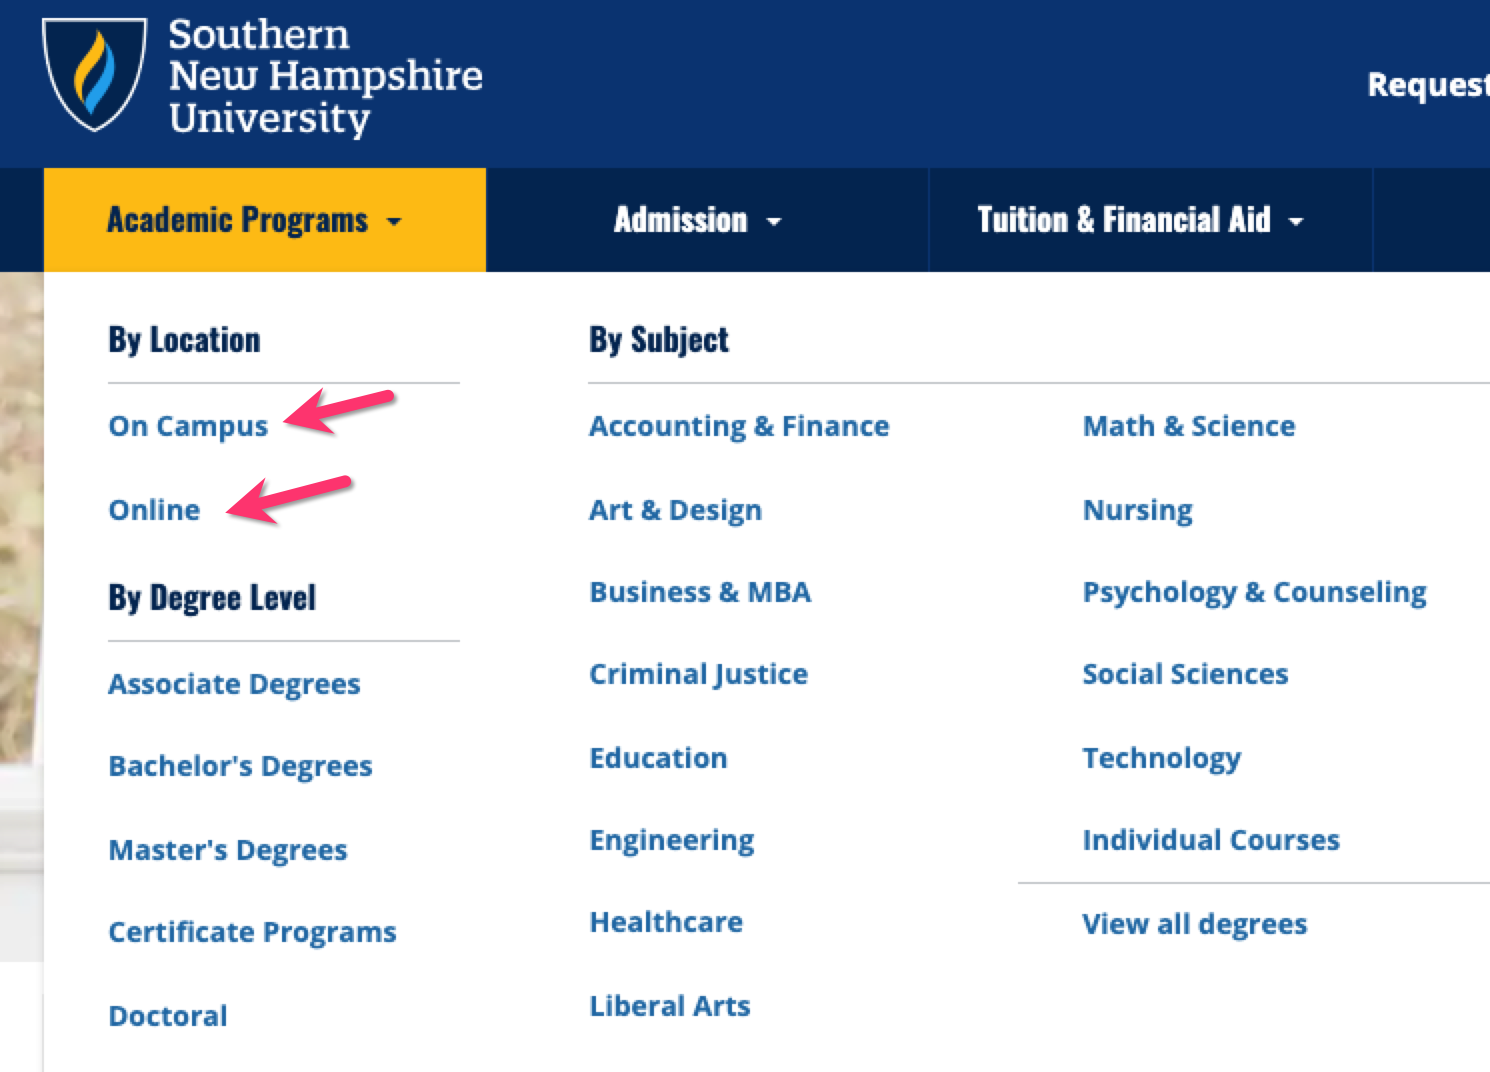
While SNHU is known for its online programs, they do offer on-campus programs as well. Here we’re going to look at the SEO performance of their online vs. on-campus program pages.
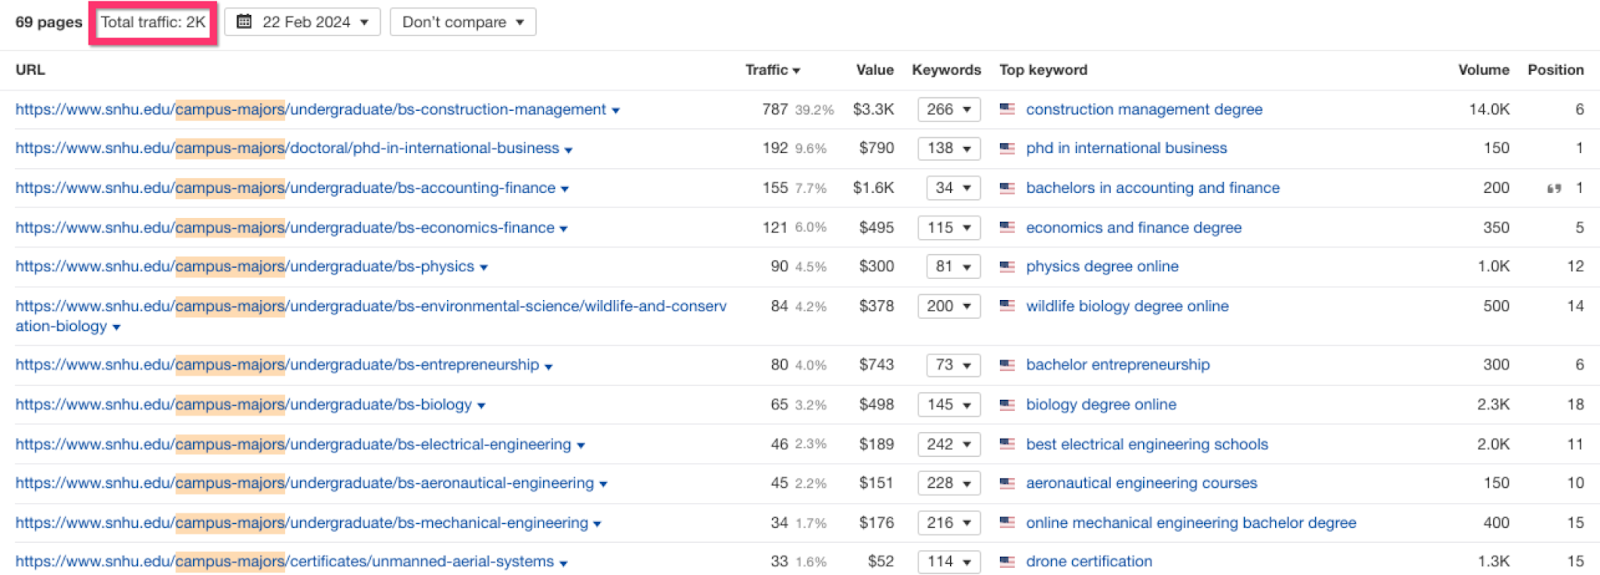
On Campus vs. Online Program Pages
SNHU has 69 on-campus program pages indexed that are ranking and getting traffic. The total traffic for their 69 program pages is just over 2,000/mo.
This is negligible compared to the traffic that SNHU gets from its online program pages.
There are two reasons why the difference is so huge. The first one is search intent, which we discussed earlier. Even for program keywords where [online] is not mentioned, most of the results will contain online program pages. This is happening because Google has determined that these results would be more relevant to the majority searching for that program.
The second reason is that online programs have more search demand vs. on-campus programs. There are more keywords that contain [online] in the query than keywords without [online]. If you have a program page that is targeting [online] like SNHU does, and your page is performing well, then you get more traffic than you would if you were targeting on-campus.
Another reason would be that on-campus programs are location-specific, which limits the number of people who could go there, and the best keywords to target would also include the location, and these keywords would have way fewer people searching for them than a general keyword.
SNHU.edu – Technical SEO Overview
This is where we get technical. A good technical SEO foundation means that Google will be able to find all the pages on your site and see all the important content on those pages. Other important technical SEO considerations also include things like website speed, UX/accessibility, website architecture, and more.
We crawled the SNHU website to better understand their technical SEO setup, and here’s what we learned:
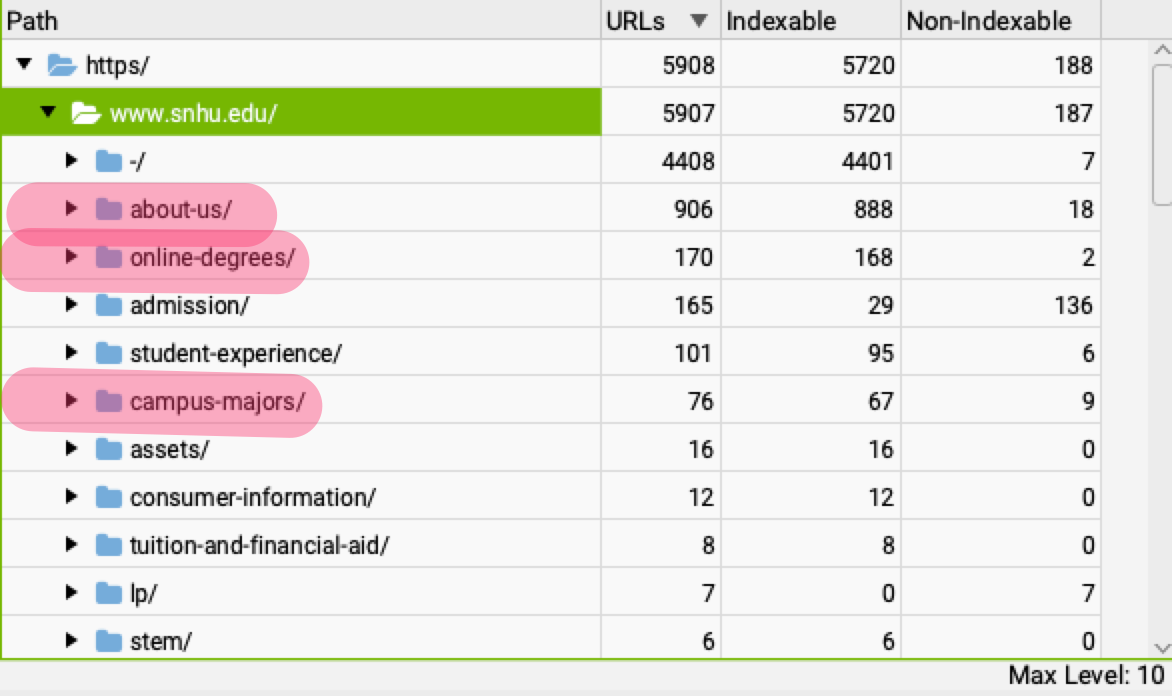
The Website Only Has About 1,500 Indexed URLs
This is a good thing. Ideally, you only want pages that are worth ranking to be indexed in Google’s search results. Usually, when we’re doing SEO audits, we see higher ed. websites with thousands of pages, most of which don’t serve the marketing purpose of the site.
We understand that a lot of these pages must exist and be indexed, but what we usually find when working with our higher ed. partners is that a significant % of these pages can either be moved to a subdomain or removed altogether.
SNHU’s setup works great for their SEO strategy. Their main site www.snhu.edu serves mainly as their marketing site, and its main goal is to generate demand for their program pages.
The reason why we look at what’s indexed is that it impacts how Google sees our site. They look at all the indexed pages, the quality of these pages, and what these pages are about to better understand what the site is about. If we’re sending mixed signals to Google, then we could risk our most important pages not achieving their potential in the search results.
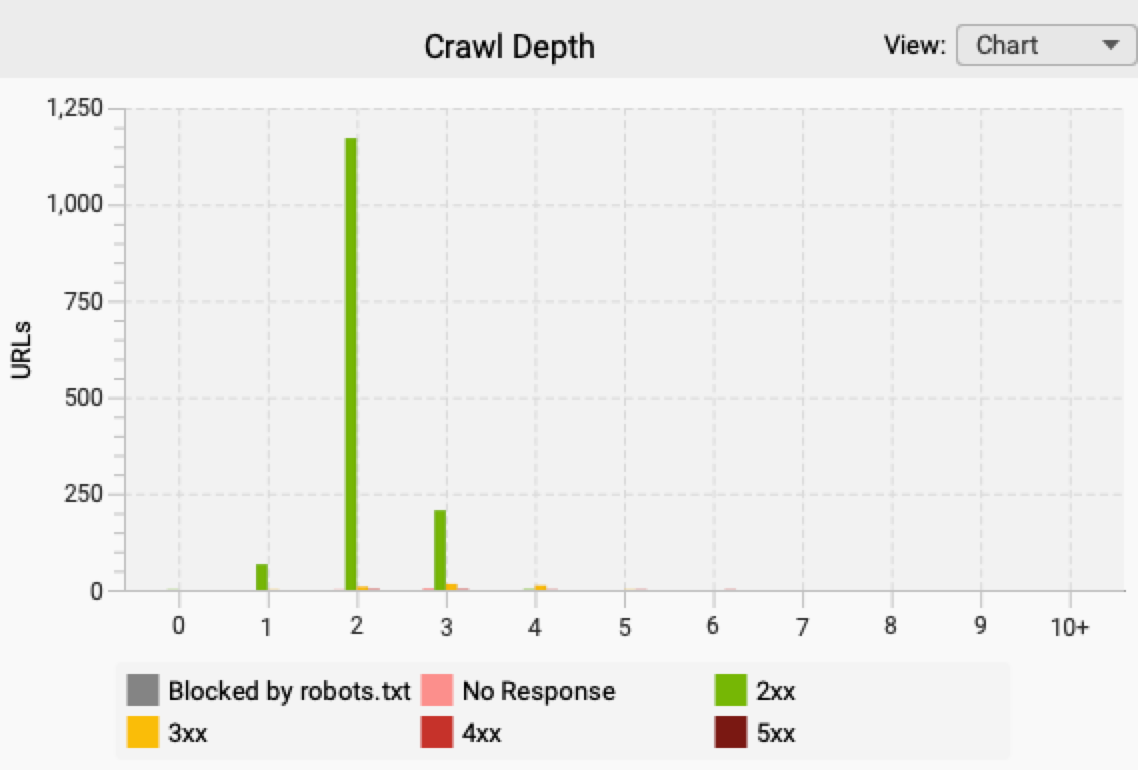
Crawl Depth – Important Pages Close to the Homepage
Crawl depth looks at how many clicks it would take Google to find a page if the starting point is the homepage. The closer a page is to the homepage, the more important it is perceived to be by Google.
In SNHU’s case, most of the pages are 2-3 clicks away from the homepage, which is ideal.
They are achieving this thanks to their HTML sitemap, which is linked in the footer.
Key Insights & Recommendations
Ideally you want to do a Technical SEO audit at least twice a year. The website changes almost daily and things break. You want to make sure that Google is able to find, index and rank all the pages on your site. If Google can’t find your pages, they won’t be able to show them to the users who are searching for them.
Beware of the ‘SEO Audit Tools’ – they will list you hundreds of issues, but most of these issues are going to be a waste of time and resources if you work on them. A good Technical SEO audit is one that has the context (what are our goals) and highlights the most important issues that will have an impact if fixed. Fixing 10 broken links or writing alt-tag text in images is great for accessibility, and we recommend you do it, but it’s not going to help with your SEO.
Do a specific check to make sure your important content is not shown using JavaScript, and if its shown, then you’re offering a pre-rendered version of it (HTML) to Google. Otherwise, Google won’t see it and your pages will hurt as a result (check if you have a ‘Program Finder’ that is interactive, that is most likely being shown using JavaScript and Google is not seeing any of these links).
SNHU.edu – Link Building
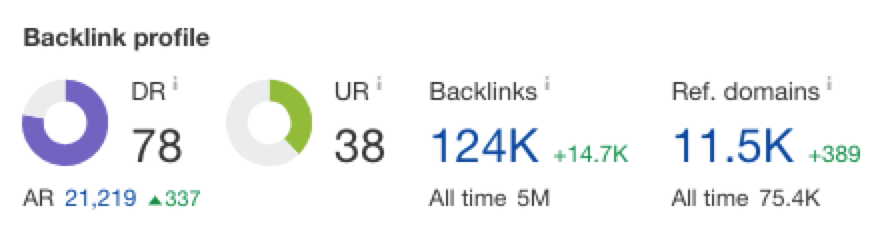
We look at two things when doing a quick analysis of the backlink profile: the number of referring domains (how many websites are linking back to SNHU.edu) and the number of backlinks (the total times these websites are linking back to SNHU.edu).
In SNHU’s case, they have 11.5k referring domains, linking back a total of 124k times.
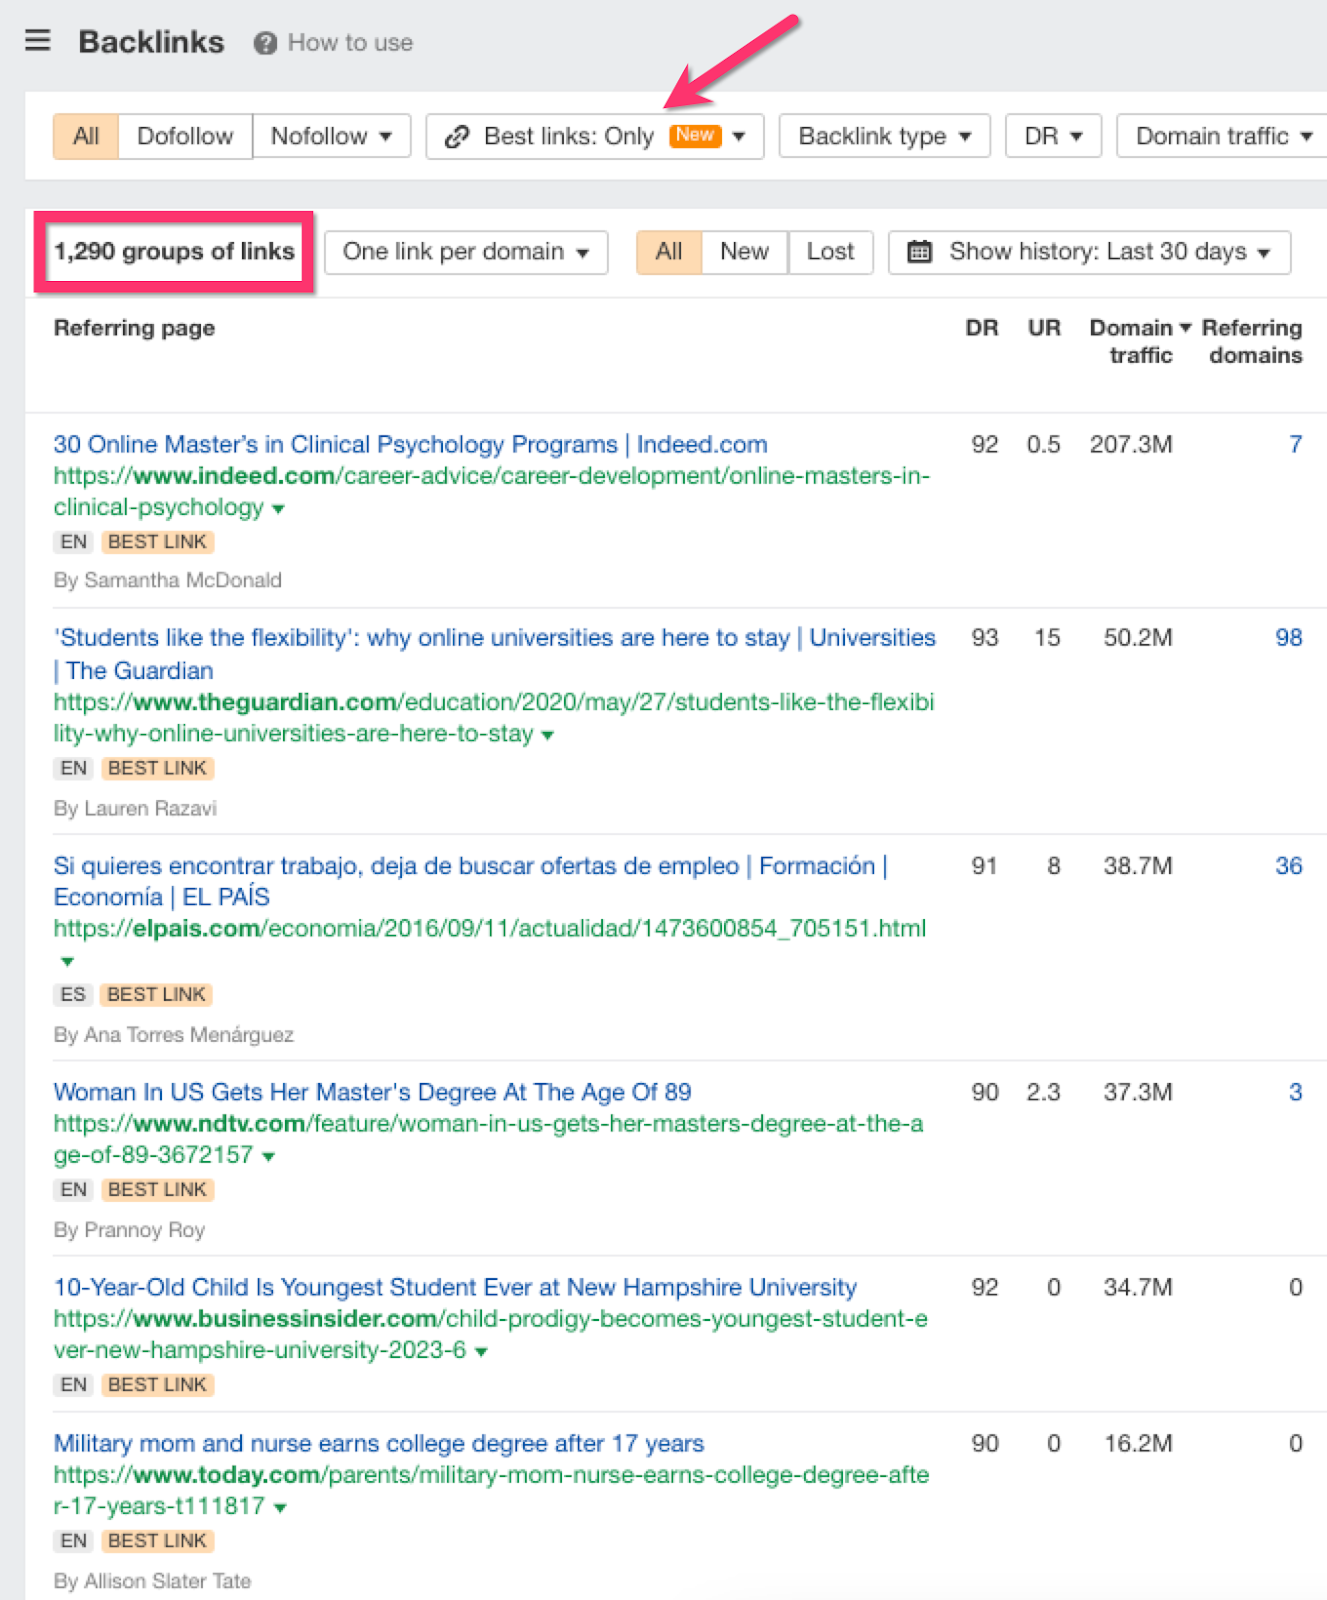
These numbers look great but they can be a bit misleading. Most of the SEO platforms/tools that we use will report on the total number of backlinks. However, we know that Google doesn’t treat all backlinks as equal and there are different factors that go into making a good backlink. Ahrefs (the SEO platform we use) has a neat feature that allows you to filter just the “Best links” – and what it does is that it removes a lot of irrelevant, low-quality links from spammy websites.
When we do this filtering, we see that SNHU has a total of 1,290 good backlinks from the likes of The Guardian, El Pais, Business Insider, Today, and more.
These are the backlinks that make the difference, and if we’re competing with SNHU, we’d look at beating this number and not the total number of backlinks/referring domains.
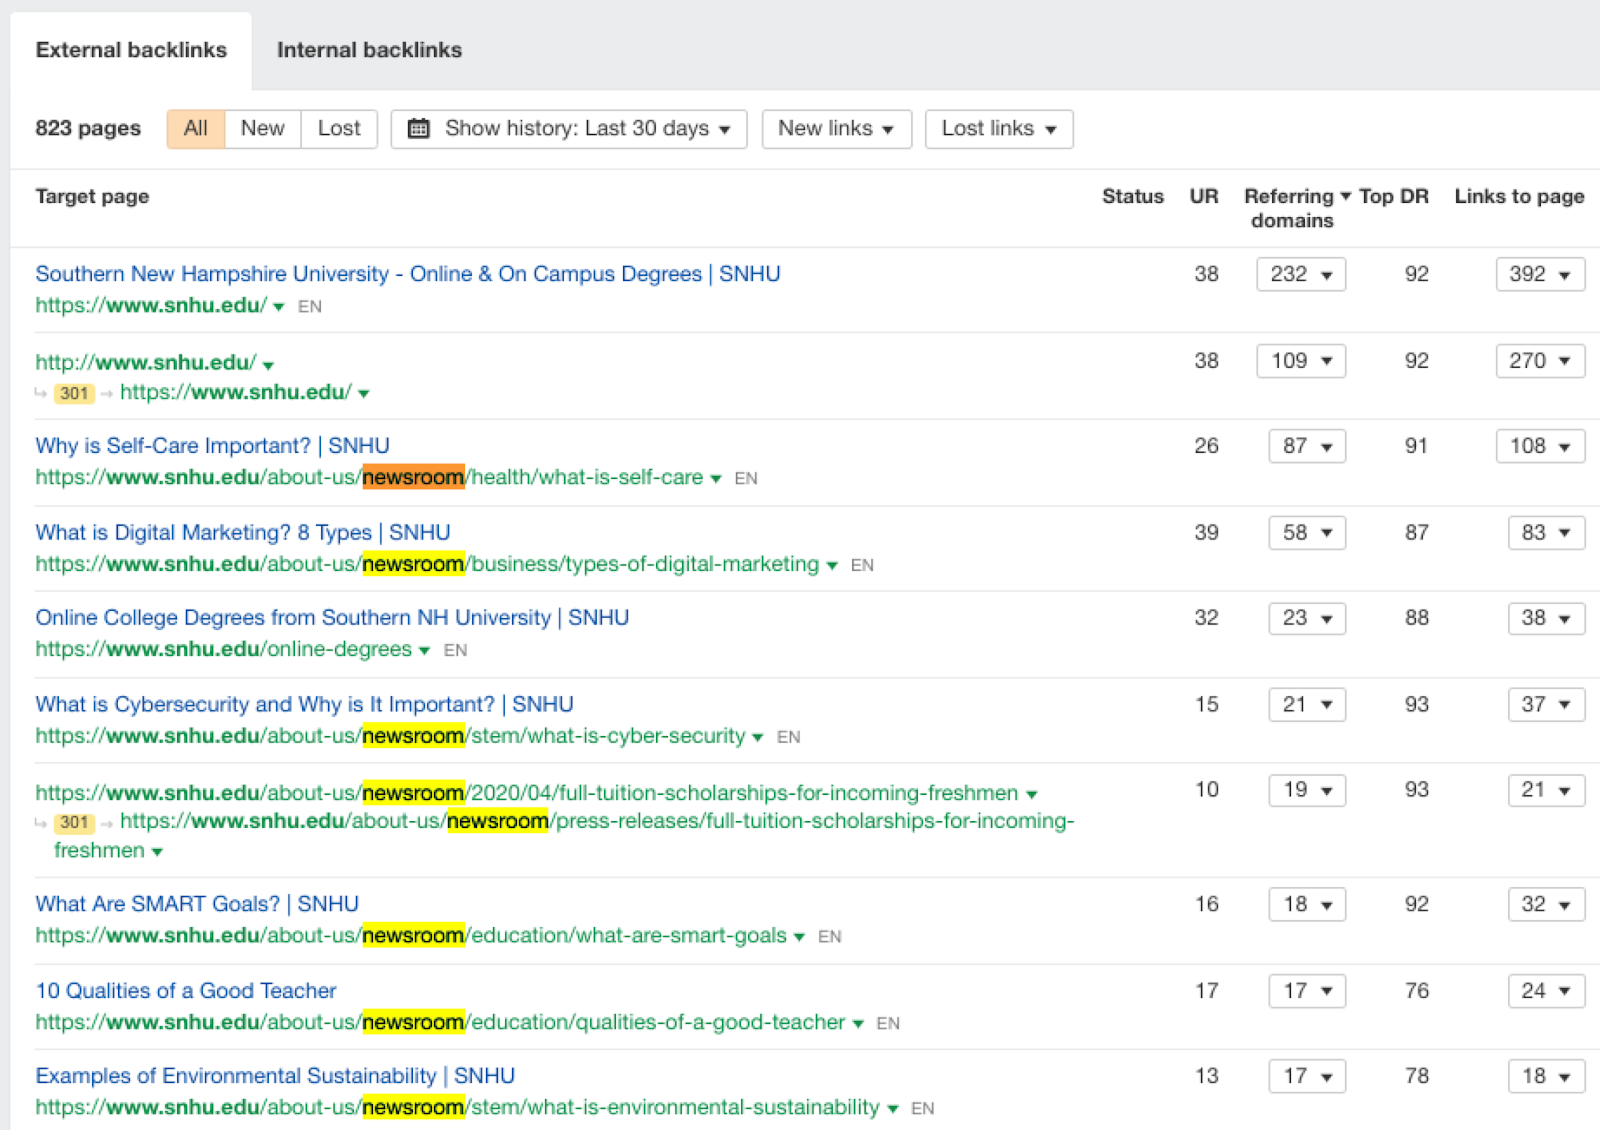
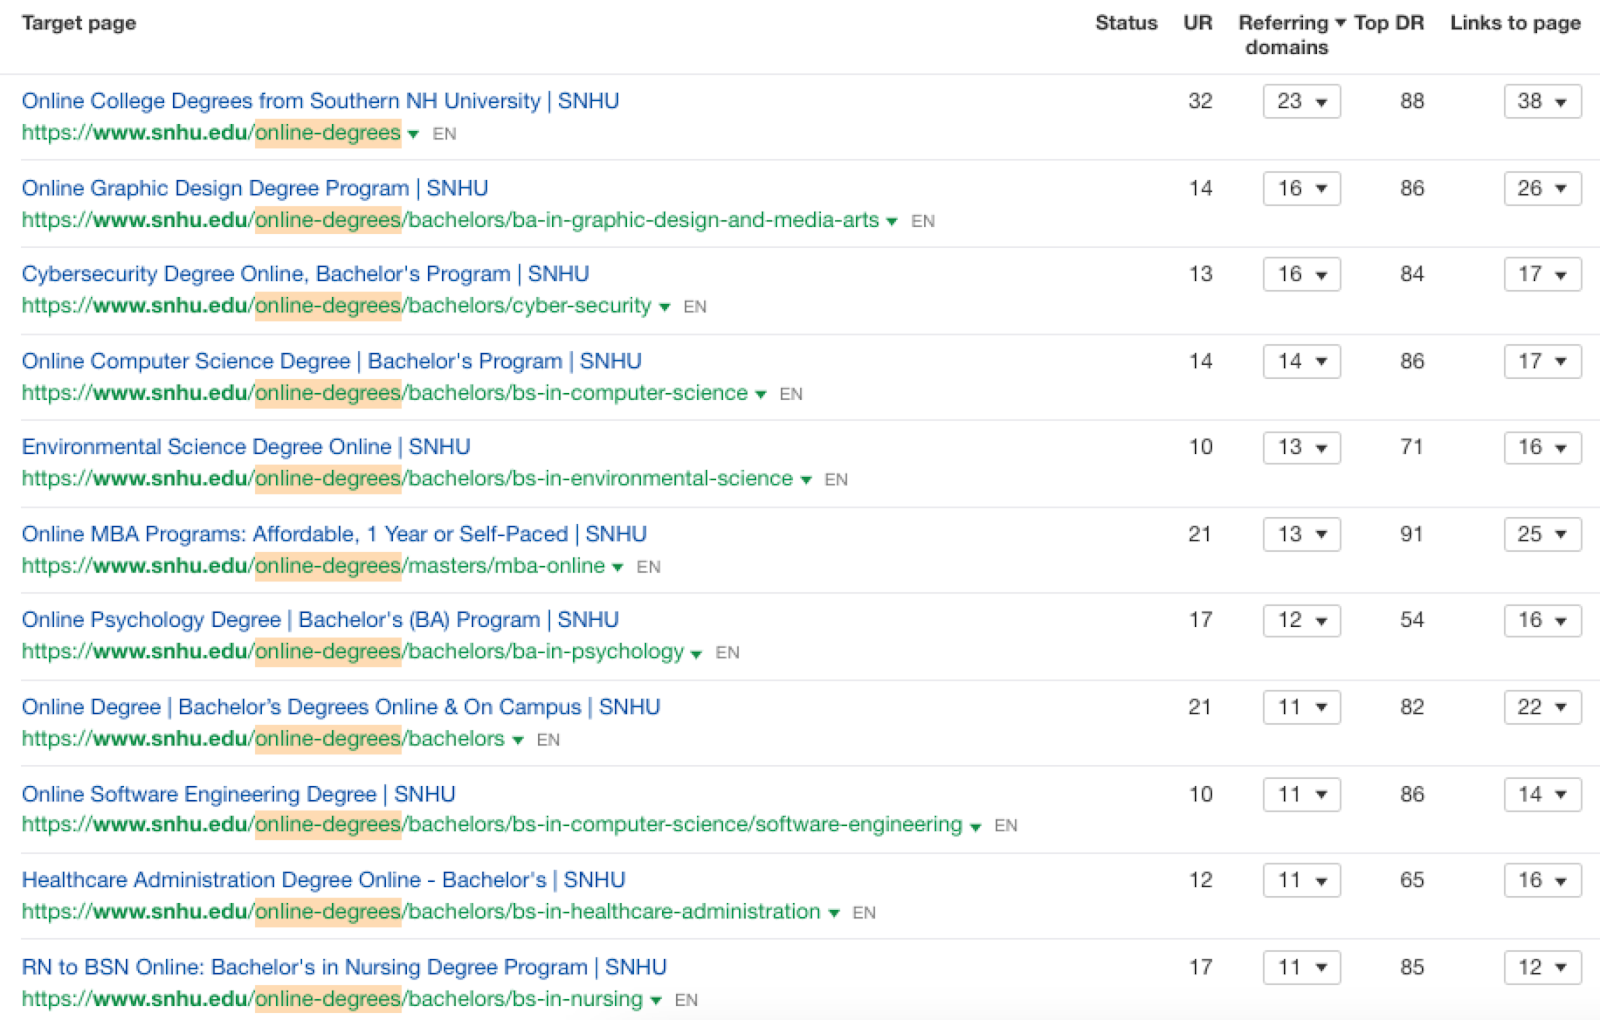
Diving deeper into this analysis, we see that apart from the homepage (which is usually the most authoritative page and has the most backlinks), the pages that have the most backlinks are blog articles. This is another side benefit of having a blog and writing content; it allows you to attract organic links passively, builds your website and program page authority, and helps with rankings.
One area where SNHU has lots of room for improvement is their backlink profile to the program pages. When we look at the report of just program pages, we see that most of their program pages have only a few referring domains.
Improving this aspect of their SEO strategy will allow them to break into the first positions for thousands of keywords where they are currently ranking in the top 3 or top 5 positions.
SNHU.edu – Organic Traffic Competition
When we talk about competition in SEO, we don’t mean your usual traditional competitors. We mean other websites that are competing for the same keywords your target audience uses to search for the programs you have to offer.
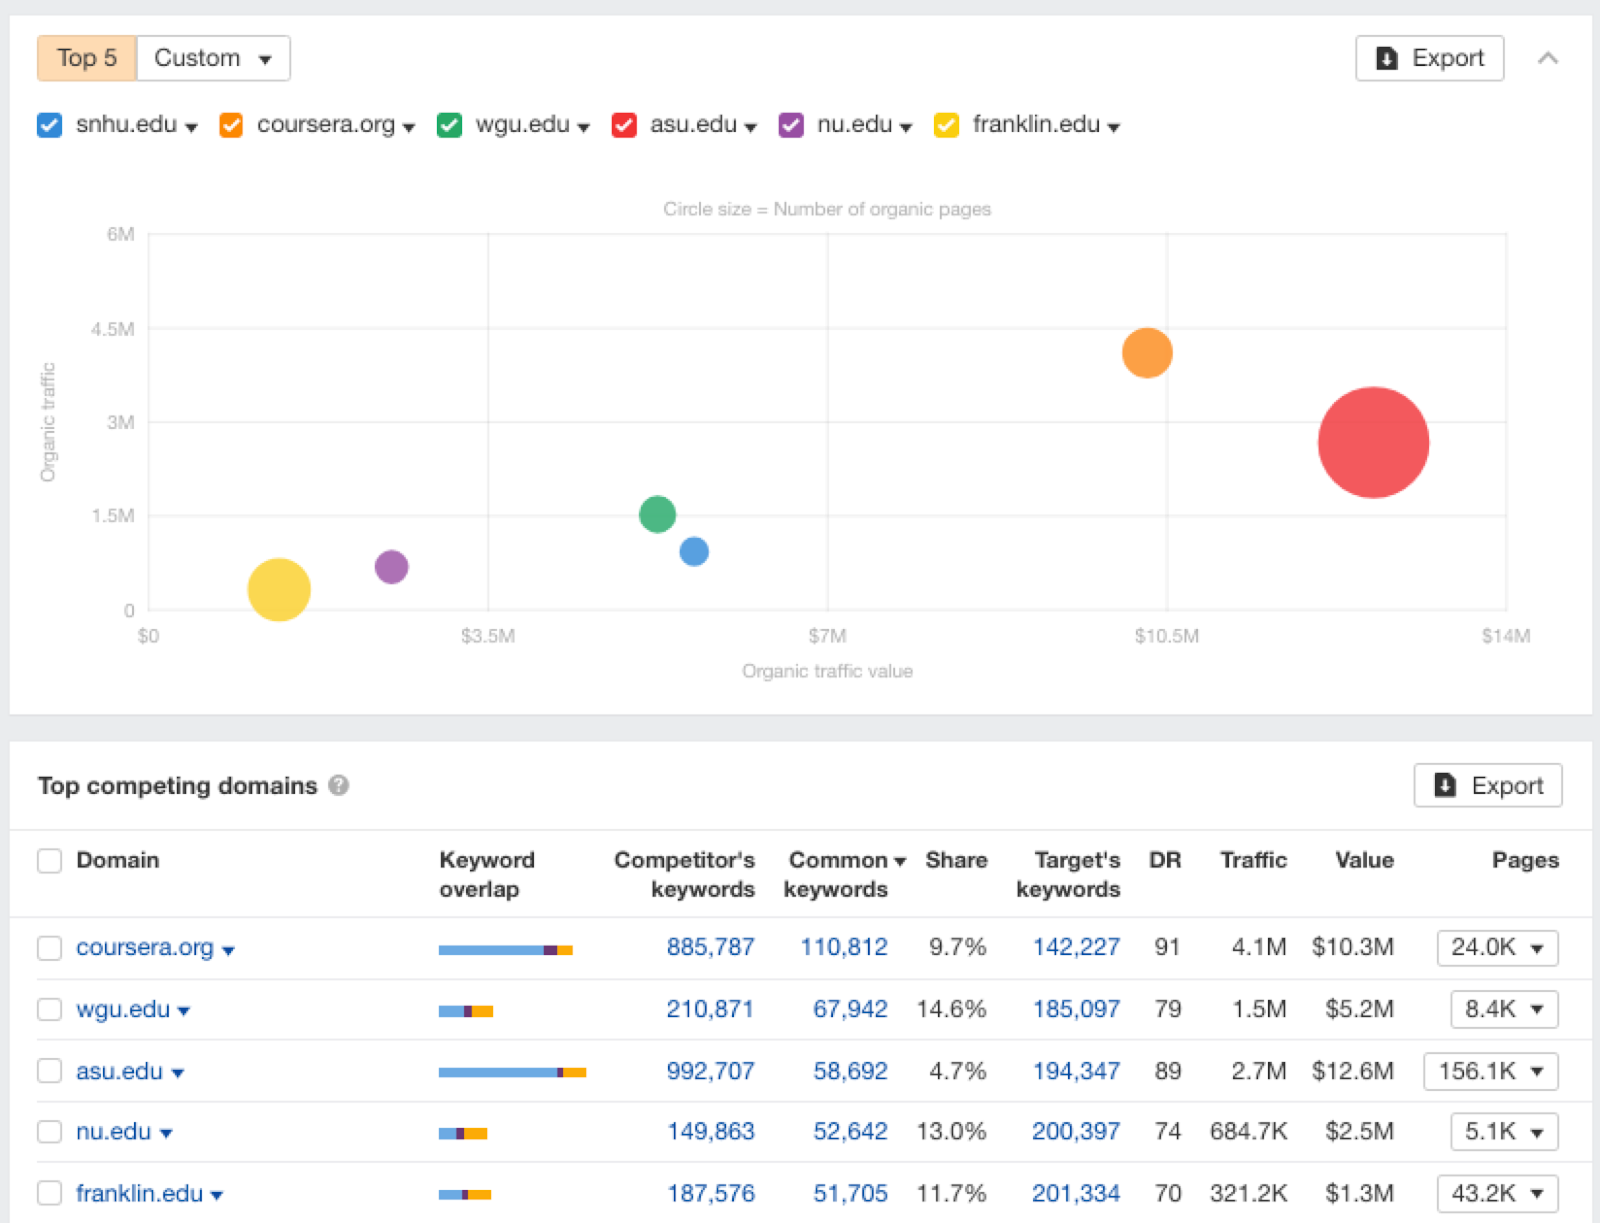
In SNHU’s case, we see the likes of ASU, WGU, Franklin University, and National University who are also ranking for the same keywords as SNHU, and then we have Coursera, the biggest competitor in terms of traffic and traffic value.
Something to note about the data shown above is ASU’s traffic value. What this means is that even though it’s getting less traffic than Coursera, most of the traffic is likely from its program pages, hence the higher traffic value.
Conclusion
Looking at SNHU’s competitors shows that there’s room for improvement for them. They are doing quite well with the traffic that their blog is providing, and their program pages are performing well, but they’re struggling to win the top spots for their target keywords. If that were to happen, their traffic and traffic value would increase significantly.
Top Higher Education Conferences in 2024: A Must-Attend List
Higher education conferences present a valuable opportunity for leaders in the field to enhance their skills and stay informed about the latest trends and challenges. As an SEO agency specializing in higher education, we have curated a list of 16 must-attend conferences for 2024.
These gatherings are not only essential for keeping abreast of industry developments but also provide a platform for meaningful interactions and networking with peers. Each conference on our list represents a worthwhile investment for professionals seeking to elevate their expertise and connections in higher education.
16 Higher Education Conferences in 2024
Spanning from early March to the year’s end, we’ve selected ten higher education conferences that are essential additions to your calendar. These events, carefully chosen for their relevance and impact, offer a diverse range of opportunities throughout the year to engage with the latest trends and network with industry peers. Mark your calendar to ensure you don’t miss these key gatherings in the higher education sector.
The 2024 SXSW EDU, as an internationally recognized event, offers a platform for educators, policymakers, entrepreneurs, and thought leaders to come together and shape the future of teaching and learning. With a diverse array of sessions, workshops, learning experiences, mentorship opportunities, film screenings, and policy discussions, the conference promises to be a transformative experience for all involved.
The event continues to distinguish itself as a true thought leadership summit, featuring hundreds of sessions and esteemed speakers from various sectors, including notable figures such as Sarah Rose Siskind (Science Comedian & Founder, Hello SciCom), Dan Ackerman (Editor-In-Chief of Gizmodo), and Rapsody (Emcee & Recording Artist, ROC Nation)
For over a decade, this annual event has drawn deep learners from around the world, providing a reminder of the profound impact educators have on shaping the future. At DL24, participants are invited to envision the limitless potential of schools as places of hope, healing, and inspiration.
Deeper Learning has been likened to “Coachella for educators,” offering a vibrant platform where individuals tap into the power of a global network of educational leaders, engage in meaningful dialogue, and collaborate on innovative school designs. The Event Team, led by Project Director Randy Scherer and School Redesign Director Tina Schuster, ensures a seamless and enriching experience for all participants, further amplifying the mission of Deeper Learning to empower every student to realize their unlimited potential.
The UPCEA Annual Conference is a significant gathering that stands out as a pivotal event for those involved in continuing, online, and other forms of non-traditional education, offering engaging keynote speakers, high-energy concurrent sessions, and ample networking opportunities. The conference agenda encompasses pressing topics in the field today, such as federal policy, finance and operations, marketing and enrollment management, instructional design, noncredit programs, and alternative credentialing.
While the roster of speakers has yet to be announced, notable figures like Ian Khan, Maria Flynn, and Javier Reyes are set to inspire and share insights on transformative trends shaping the future of education.
Building on the association’s esteemed legacy since 1920, AACC Annual has consistently served as the cornerstone event for the nation’s predominantly associate degree-granting regionally accredited institutions. This premier gathering offers a dynamic platform featuring impactful keynote presentations, focused breakout sessions addressing key sector challenges and opportunities, demonstrations showcasing disruptive technologies, and intensive problem-solving sessions.
AACC Annual is an unparalleled opportunity to engage with the nation’s community college leaders, collectively serving over 40 percent of the nation’s undergraduates. This event fosters an environment conducive to designing solutions for today’s priority challenges while identifying innovative opportunities to support the diverse needs of community college students nationwide.
The ASU+GSV Summit for 2024 is set to be a transformative three-day event, gathering some of the world’s foremost experts in business, entrepreneurship, higher education, and education innovation. With a mission to foster a future where all individuals have equitable access to opportunities, the summit emphasizes the pivotal role of scaled innovations in education and workforce skills delivery.
Past editions of the summit have featured an illustrious lineup of speakers, including prominent figures such as Barack Obama, George Bush, Priscilla Chan, John Legend, and Bill Gates. This year’s roster promises to be equally inspiring, with speakers like Ashley Andersen Zantop, Jenny Anderson, Emma Bloomberg, and Ruby Bridges, alongside numerous other influential voices poised to share insights and drive forward-thinking conversations.
The 2024 NAGAP Conference, hosted by the Association for Graduate Enrollment Management, serves as a premier gathering for professionals dedicated to the intricate landscape of graduate enrollment management (GEM). As the only professional organization exclusively focused on the concerns of those working in GEM, the conference provides a vital platform for networking, gaining insights, and sharing knowledge among peers and experts in the field.
While speakers for the conference are yet to be announced, attendees can anticipate engaging sessions, thought-provoking discussions, and invaluable resources to advance their careers and drive excellence in graduate enrollment management.
In 2024, the National Association of Foreign Student Advisors (NAFSA) will convene again in the United States, bringing together professionals to address critical issues pertaining to foreign students and international education programs. The conference is particularly suitable for international educators and administrators seeking to enhance their knowledge and expertise in navigating the complexities of global education.
While spotlight presenters are yet to be announced, attendees can anticipate a stimulating lineup of speakers, including the May 28 Plenary featuring Luis von Ahn, an esteemed entrepreneur and former professor at Carnegie Mellon University, whose insights promise to inspire and inform discussions on the future of international education.
The annual Slate Summit returns to Navy Pier in Chicago, promising an immersive experience into the intricacies of the student lifecycle. Hosted by Technolutions, a leading software development firm specializing in higher education information management systems, this conference is a must-attend event for educators and higher education experts utilizing Slate CRM.
Designed to explore marketing automation and CRM innovation for higher education, the 2024 Slate Summit offers expert-led sessions, network opportunities, and affinity group breakouts tailored to the needs of the Slate community. Join peers from esteemed institutions like NYU Undergraduate Admissions, Occidental College, and Ohio University for a deep dive into the latest trends and challenges shaping the future of student enrollment and engagement.
In 2024, educators from around the globe eagerly anticipate the 13th edition of PBL World, a multi-day conference dedicated to Project-Based Learning (PBL) presented by PBLWorks. This premier event serves as a pivotal gathering for teachers, instructional coaches, as well as school and district leaders, all unified by their commitment to initiating and advancing their practice of Project Based Learning.
Although the keynote speakers for the event have not been announced yet, the attendees can expect insightful talks from carefully selected speakers. These talks will focus on how high-quality Project-Based Learning can transform the lives of all students while reigniting the joy of learning for both students and teachers.
Big Bang is the annual conference hosted by Big Picture Learning, which is dedicated to fostering student-centered learning. This unique gathering brings together students, educators, leaders, and partners in an intergenerational collaboration where everyone is considered an equal contributor to the learning process.
Participants have the opportunity to learn from each other as well as from the host community, creating an environment rich in diverse perspectives and experiences.
More information and details about this event are coming soon.
As the world grapples with unprecedented challenges and accelerated technological advancements, the imperative to navigate an uncertain future grows ever more pressing. This conference highlights the key role of marketing in guiding individuals, businesses, and societies toward preparedness and resilience in the face of uncertainty.
This conference covers various topics such as digital marketing, global marketing, and sustainability, offering valuable insights into marketing research and practice. Some notable conference tracks include:
Advertising, Promotion, and Marketing Communications:
This year’s EAIE event will explore the dynamic landscape of international higher education, focusing on integrating sustainable practices, exploring digital technologies, and fostering innovative approaches to support the diverse needs of students and staff. As professionals in the field, we are committed to continuous learning and identifying opportunities for growth and development.
While the lineup of speakers is yet to be announced, the conference offers professionals working in international higher education an opportunity to apply for sessions. These sessions are open to all participants and will provide dynamic forums for exchanging ideas. Facilitated by session chairs, the discussions will encourage interactivity and allow diverse perspectives to flourish.
The National Association for College Admissions Counseling (NACAC) annual conference stands as the premier event for professionals in the college admission counseling field, and in 2024, it returns to Los Angeles. This highly anticipated gathering offers a platform for experts to convene and exchange best practices, innovative ideas, and cutting-edge research in college admissions.
With over 200 exhibitors and more than 100 education sessions, attendees can expect a wealth of resources and opportunities for professional development. Tailored for college admissions specialists and recruitment counselors across the United States, the NACAC conference promises to inspire and empower attendees to navigate college admissions with confidence and expertise.
The PLTW Summit offers an unparalleled opportunity for STEM educators nationwide to come together every two years for transformative professional development and networking. This event is designed to inspire educators, connect them with Master Teachers, PLTW partners, and peers, and provide valuable insights into improving student outcomes through PreK-12 STEM programs.
Through the keynote speakers, interactive breakout sessions, and hands-on experiences with the PLTW curriculum, attendees will gain practical skills and strategies to enhance their classroom instruction. The summit also fosters connections within the PLTW community, empowering educators to collaborate and innovate to advance STEM education.
The Rural Schools Conference is a platform that promotes collaboration and innovation among a diverse community of national experts, K-12 and higher education practitioners, leading researchers, policymakers, and philanthropic leaders. The event is hosted by the National Rural Education Association and Rural Schools Collaborative in partnership with the Georgia Department of Education. It aims to enable rural communities to harness local resources and create meaningful student learning experiences.
The conference is expected to attract hundreds of participants and promises to be an exciting platform for sharing knowledge, building partnerships, and driving positive change in rural education nationwide.
At this premier event, attendees from across the education transformation space converge to engage in action-oriented learning and development, fostering connections and collaborations vital for advancing change in their work. With a focus on real-world solutions and visionary practices, the Symposium offers insights into next-generation learning models, equity-driven approaches, and future-focused education transformation.
The Symposium caters to educators, school leaders, policymakers, researchers, and innovators alike, featuring highly rated professional development sessions, workshops, and comprehensive information on new trends and successful policies. Proposals for presentations are currently being accepted, with keynote speakers set to be announced soon.
Registration will be open in Spring 2024.
Conclusion
Among the many conferences planned for the year, these 16 stand out as essential for higher education leaders. From renowned events like the AACC Annual and ASU+GSV Summit to more specialized gatherings like PBL World and EAIE Conference, each offers unique insights into the challenges, trends, and innovations shaping the educational landscape as well as invaluable networking opportunities.
Each conference promises to deliver fresh perspectives, collaborative connections, and moments of inspiration. Seize the opportunity to expand your horizons, cultivate relationships, and immerse yourself in the dynamic world of education.
Google Analytics 4 for Higher Education: A Comprehensive 2023 Guide
As an agency that specializes in Higher Education SEO services, we know how important it is to stay on top of the latest trends and tools. As digital transformation continues to reshape the industry, university administrators and marketers must continually analyze user behavior, monitor ROI, and devise effective marketing strategies. One of the most widely-used tools for this type of analysis is Google Analytics.
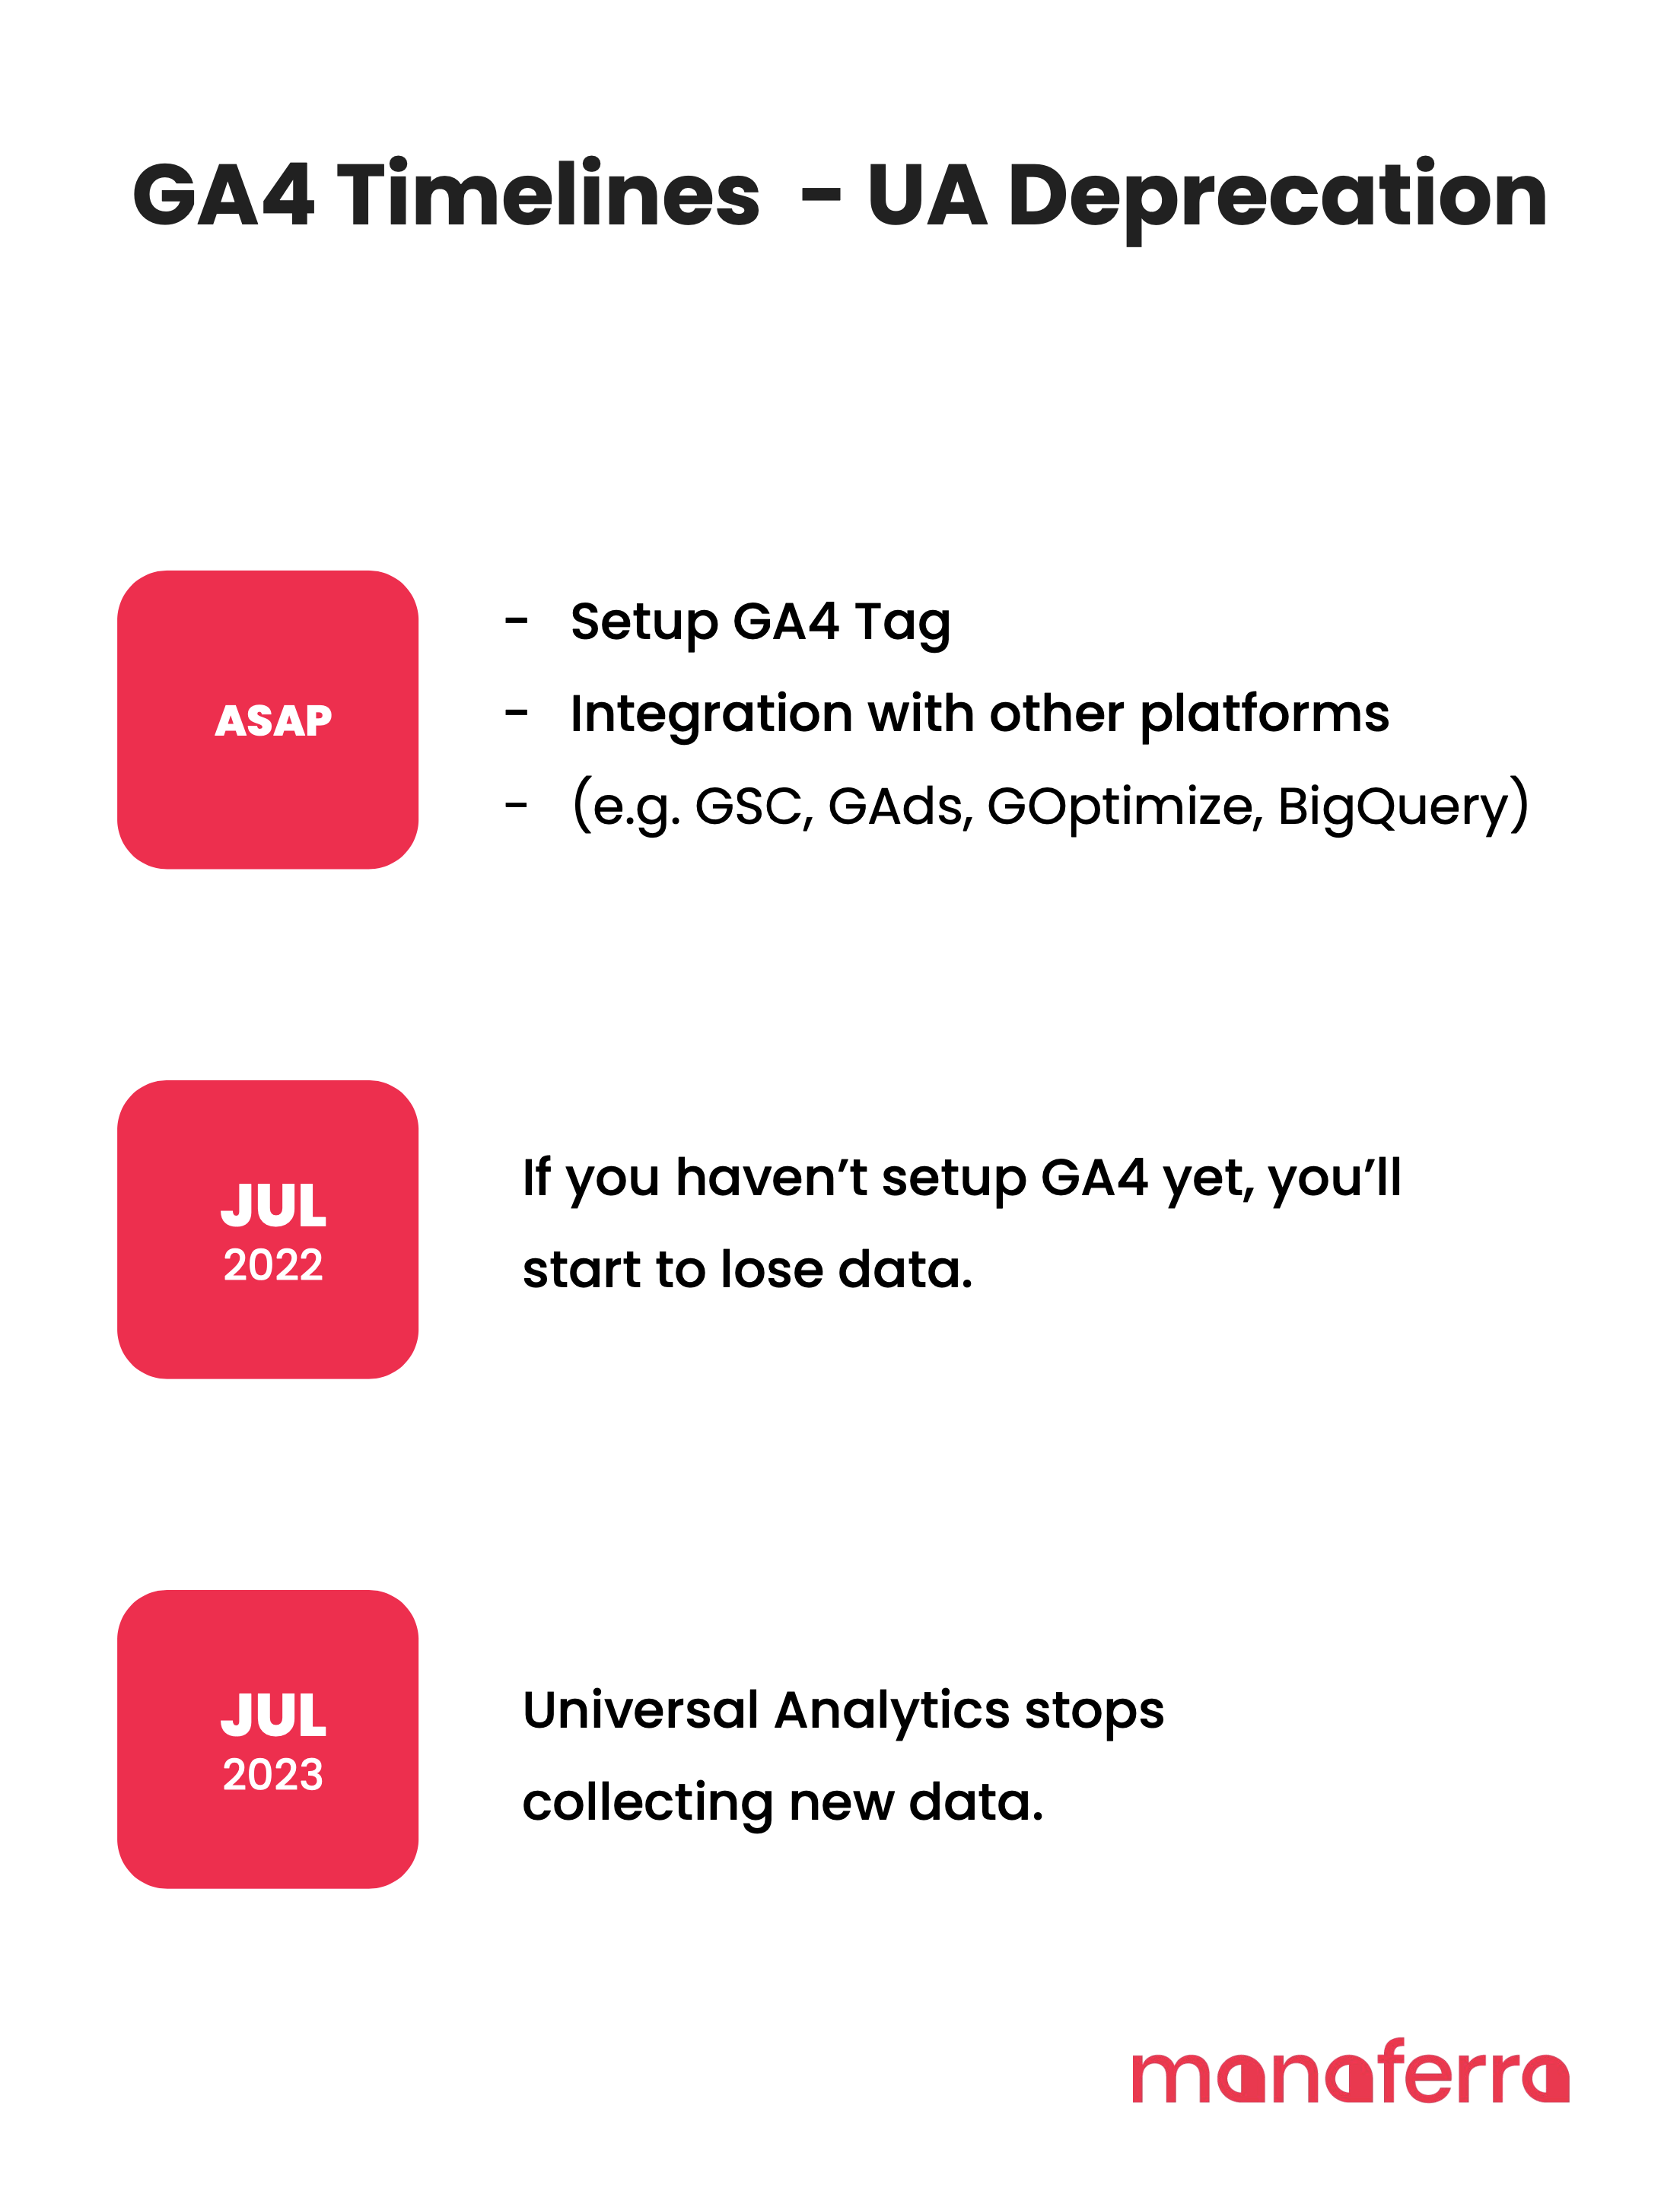
But did you know that the current version of Google Analytics (Universal Analytics) will stop collecting new data starting in July 2023? This means that unless you move to another analytics platform, you’ll need to migrate to the latest version of Google Analytics, called Google Analytics 4, as soon as possible to avoid losing any valuable data.
Get started with GA4 for your website
Migrating from Google Universal to Google Analytics 4 is no simple task. Sure, account setup is relatively straightforward, but setting up the proper conversion tracking is much more complicated now. Google Analytics 4 has its advantages and disadvantages, but like all new forced changes, it will take time to get used to. Google Analytics 4 will actually be an improvement on your analytics data as it is based solely on events and parameters.
Let our team of Google Analytics 4 experts do the heavy lifting for you.
In this blog post, we’ll provide a guide for higher education marketers looking to migrate accurately from Google Analytics UA to Google Analytics 4. We’ll cover the key steps you need to take, the benefits of the latest version, and how to ensure a smooth transition. Don’t miss out on the powerful features of Google Analytics 4 – read on to learn more.
What’s new on Google Analytics 4 (GA4)
Since Google Analytics’s inception in 2012, many things have changed with the rise of mobile apps, consumer behavior shifts, privacy regulations, big data, and the way we collect and analyze data. Google needed to consider and reflect on how its current Analytics tools evolved to fit market changes and demand. This must have required a 10.000-foot view of the whole spectrum, starting from how the data are collected and presented, to deliver seamless insights and data-informed decision making.
Saying that Google Analytics 4 is an update or an upgrade from Universal Analytics would be an underestimation of reality. The best way to think about it is as a completely new product, built on a different data model, made for scalability, machine learning, privacy, and customization.
To understand how those two versions of Google Analytics differ from one another, we will break down some of the main differences, so you can have a clear picture of the new platform before starting to migrate to GA4.
Data Collection
The ability to analyze data depends highly on how those data are collected and organized in the first place. The better they are organized, the easier it will be to make further data manipulation and analysis.
Data collections represent a fundamental difference between Universal Analytics and Google Analytics 4.
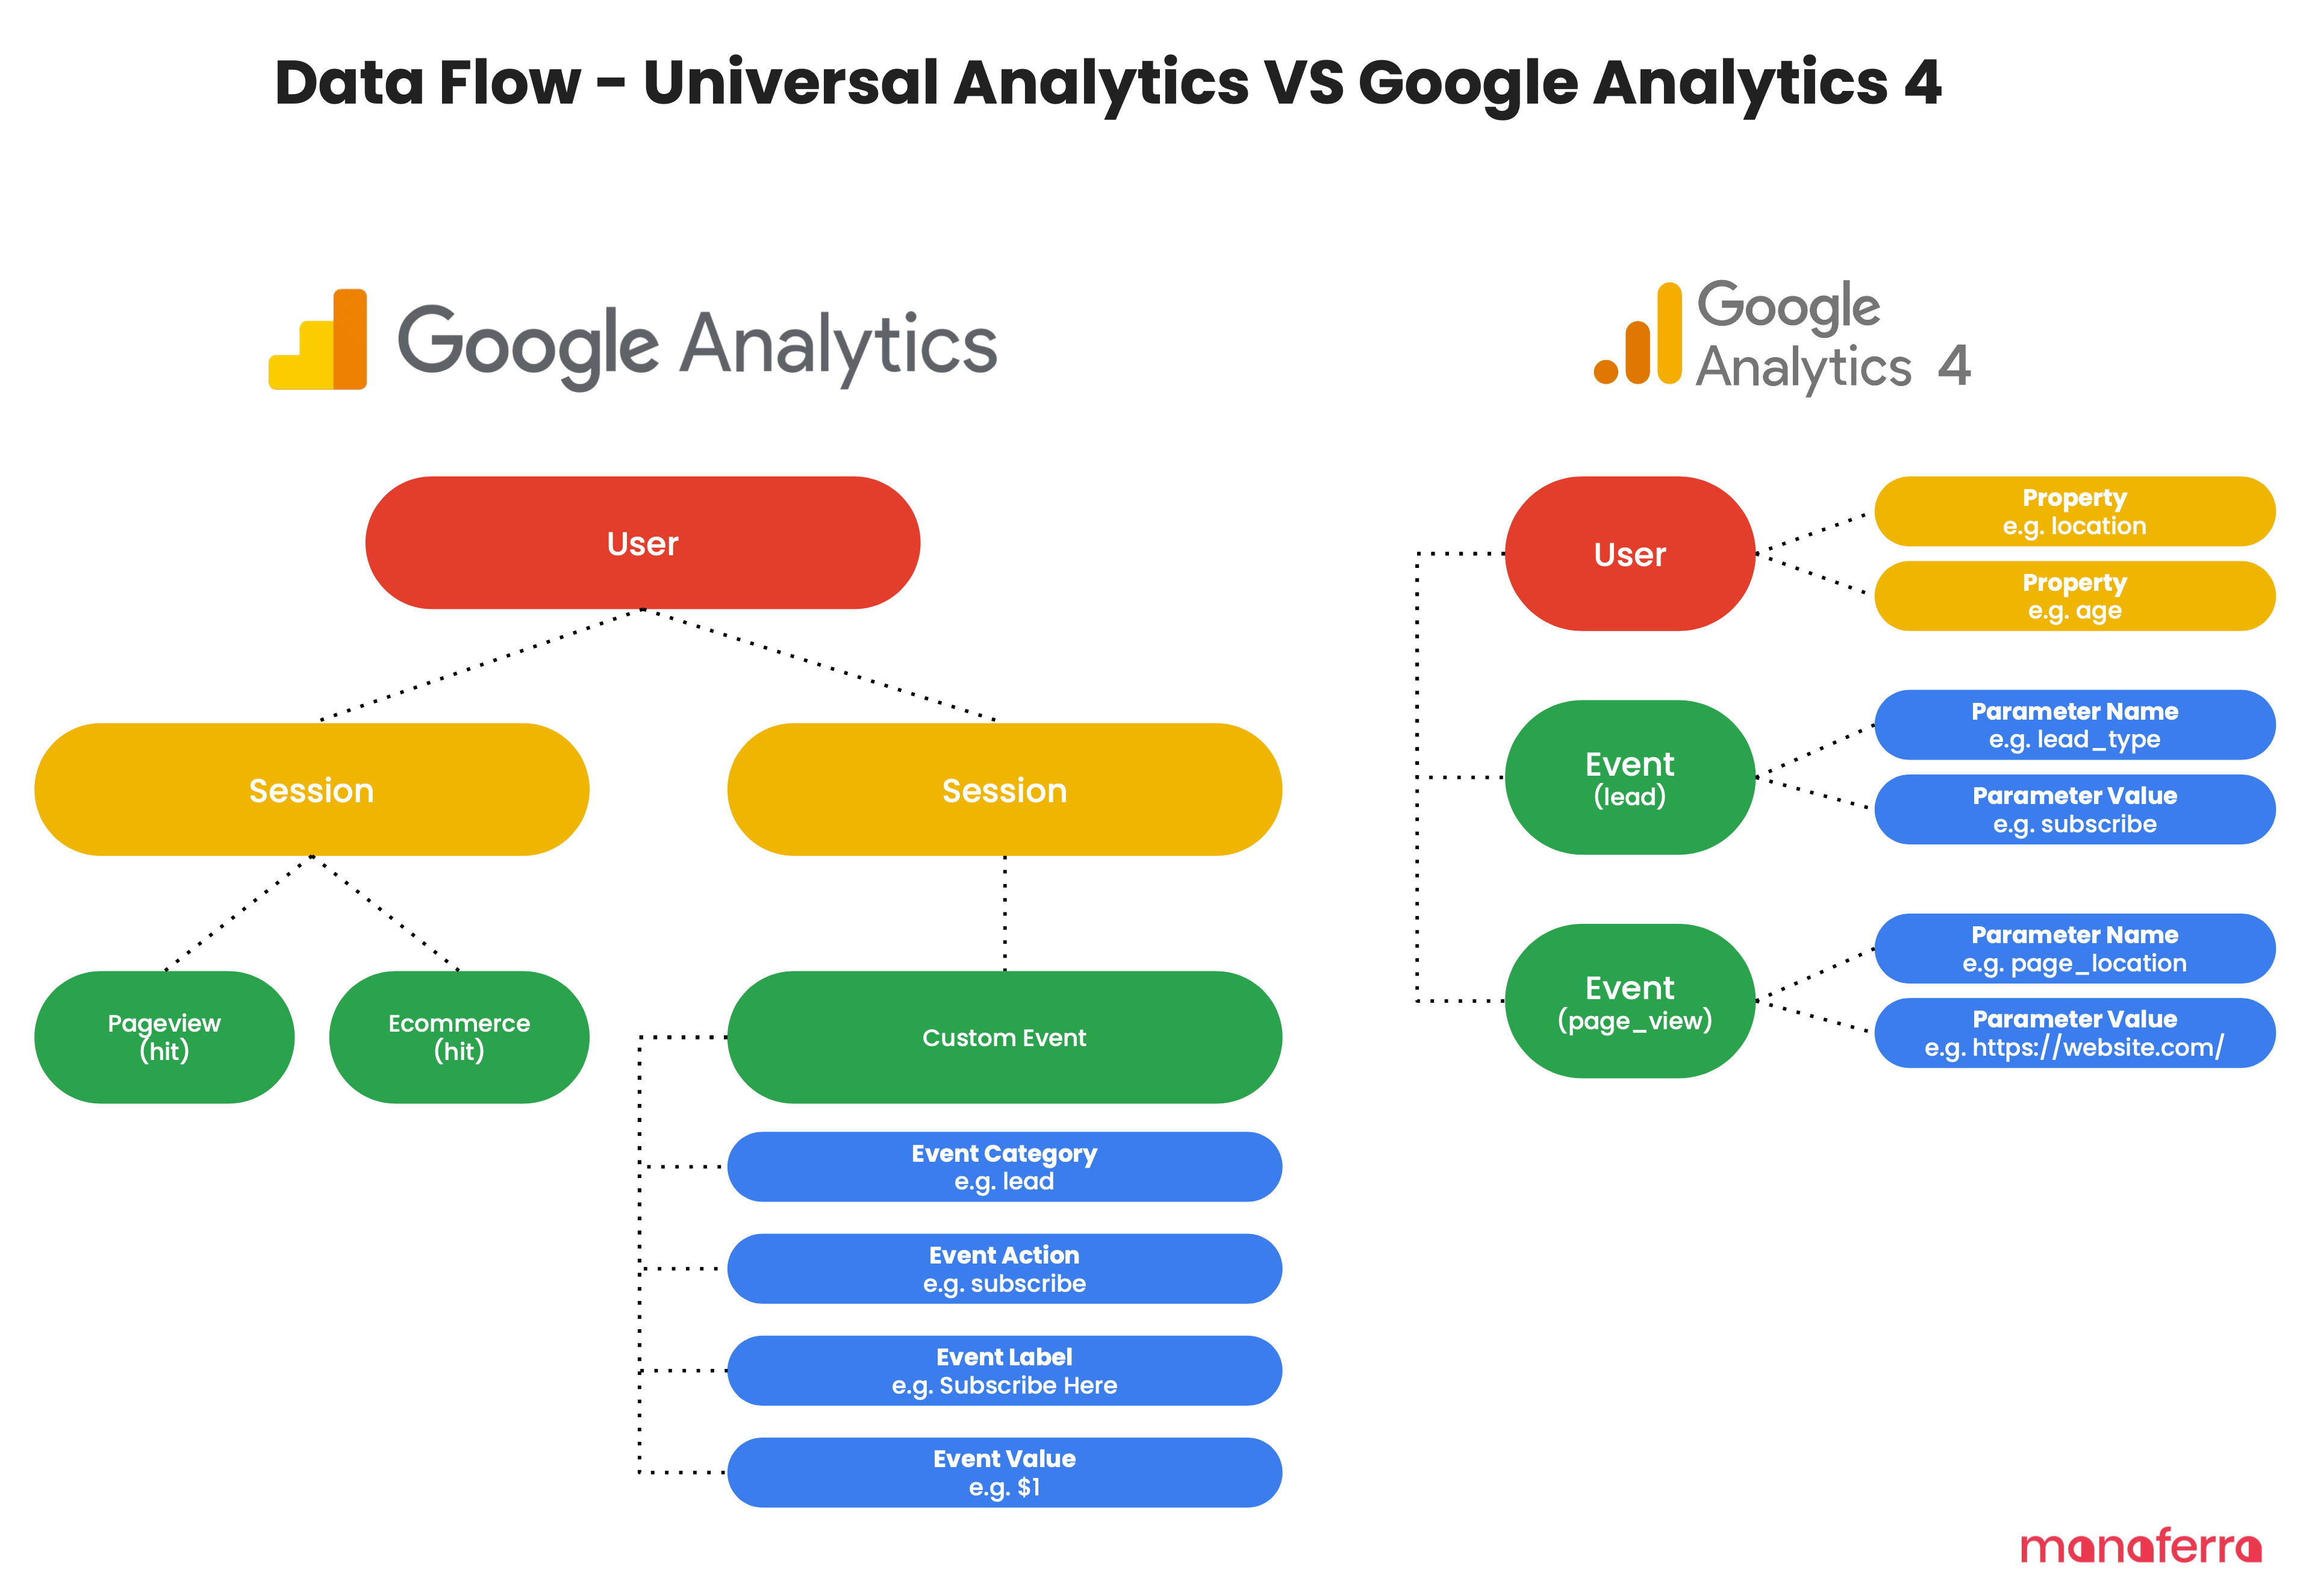
Universal Analytics (or GA3) organized all of its data into Sessions and Hits. All information that went to Google Analytics belonged to a Session, which belonged to a User. This data modeling doesn’t give you much space to collect and organize information around your users and their behavior, especially across multiple devices. That’s because you had numerous data layers that were not communicating with each other, and making it work required A TON of custom work.
On the other hand, Google Analytics 4 has an entirely different data model, which is simpler yet powerful. Any interaction on your Web or Mobile is organized under Events (Event scoped), which belongs to a User (User scoped). A Session is an event, a Page View is an event, a File Download is an event, an Ecommerce sale is an event, and so on, you get the idea.
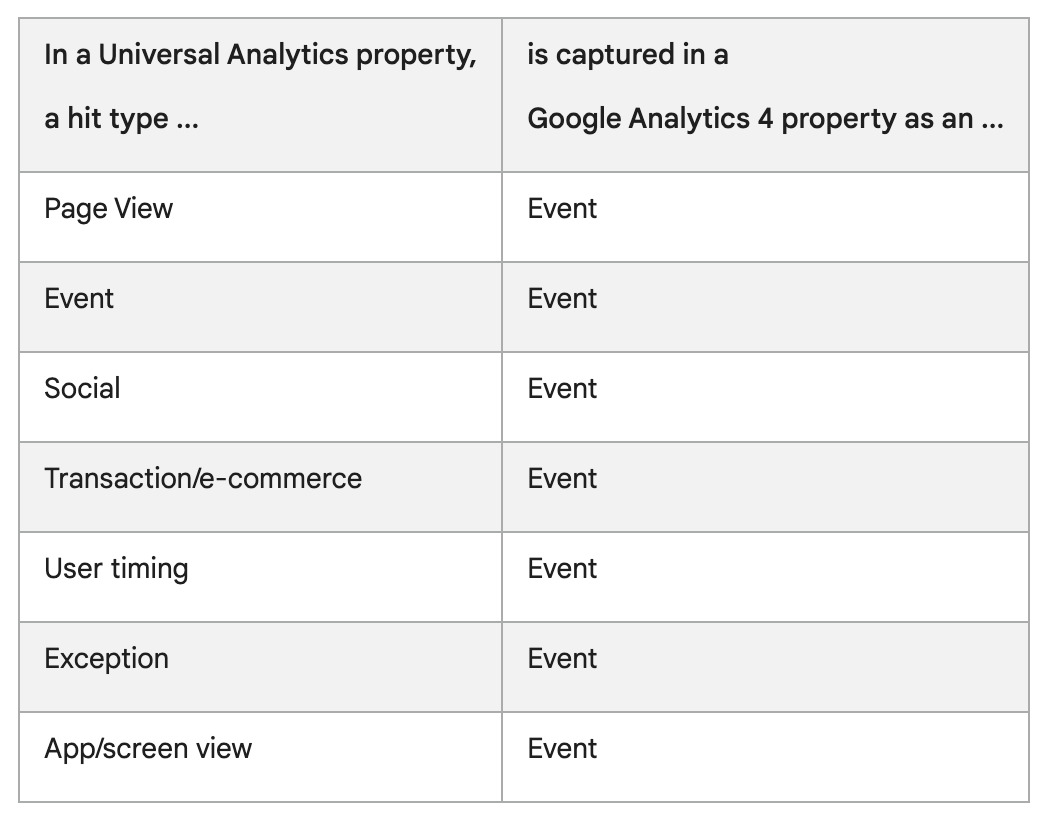
In GA4, when someone views one of your website pages, a page_view event is triggered, and that event will be saved under a specific User in GA4. Here is how previous hits translate to Events in GA4.
This data collection model gives Google Analytics 4 an edge over its predecessor in analyzing user behavior across multiple devices and building custom reports. This is because GA4 can link all interactions to a User, and enables you to organize them the way it fits your needs. That’s why GA4 needs more customization setup than GA3, where you had a ton of pre-defined reports built with a “one size fits all” approach.
Data Retention & Privacy
One of the most significant changes from UA is user data retention, or “how long does Google save user interaction data”. In UA, the default option for data retention was “unlimited”; however, in GA4, the longest you can hold on to Events and User data (including conversions) is 14 months.
Having a maximum of 14-month-old data might freak out a lot of higher education marketers as they won’t be able to make YoY comparisons; however, there are workarounds to this, such as integrating GA4 with tools like BigQuery and reporting them via tools like Google Data Studio. BigQuery allows you to export raw data unsampled to conduct a much more granular analysis with confidence in your data, which I highly recommend before your data expires from GA4.
This limitation in data retention does not apply to standard aggregated reports, where you will be served reports based on sample data.
AI + Machine Learning
Google uses Machine learning (ML) on GA4 to fill in data gaps and make predictions by looking for patterns, feeding those data into AI algorithms, and predicting the future behavior of your users.
However, In a cookie-less and privacy-conscious world, tracking users’ activities is not something platforms like GA4 can ignore, and that’s where Machine Learning comes in. It fills out the data gaps and provides predictions by putting users into different cohorts and creating a composite overview of how people with certain traits move through your university website.
This is very helpful for universities as it allows them to predict their university’s growth by making predictions on potential students (leads) you could get next semester. If you have conversion rate data from your past activities, you can easily make necessary calculations that would lead you to predict enrollment numbers.
Machine Learning also powers up Automated Insights, which helps you observe trends and keep an eye on changing user behavior. For example, you can be alerted to changes in application numbers, which might lead you to understand that the application form isn’t working as expected.
Recommendation:
Do not forget to create anomaly detections when you set up GA4.
Cross-Device Tracking
Cross-device tracking is at the heart of GA4. The new data model enables GA4 to consistently store data from multiple sources and report them back into the same Analytics property for further analysis.
GA4 bases its cross-tracking mechanism on something called “Identity spaces”. It tries to identify a user using multiple data points without revealing their identity. This is done by using three different types of identifiers, which enables it to stitch them together into a single unified cross-device user journey:
GA4 creates a single user journey from all the data associated with the same identified identity. Because this identity is used in all reports, they allow you to de-duplicate users and tell a more unified, holistic view of their relationships with your university.
For example, suppose your university offers a login area for your students. In that case, you can assign User IDs along with the interaction data you send to GA4 when a student enrolls (you might need the help of a developer to implement this) and later map the entire journey of that student in Analytics.
If you don’t have a User ID to assign to events, you can enable “Google signals” and all data sent to Google Analytics will be associated with that user. However, Google will only be able to assign these User ID’s to signed-in users who have consented to share this information.
If you do not enable Google Signals, the only option left for Analytics will be to identify users based on Device ID; however, that alone might not be enough to allow cross-device identification.
FREE RESOURCE
Download Our Free Step-by-Step Guide to Setting Up Google Analytics 4 for Universities
Learn what you need to know, from migrating your UA data to configuring conversions and filtering
GA 4 lets you build custom audience segments based on your site visitors’ behavior and interests. They are groups of users created based on dimensions, metrics, or events that you can use during your analysis and show ads to them via Google Ads.
As your Google Analytics keeps receiving data about new users from your university website, audiences are constantly reevaluated to make sure that they meet the criteria you had defined when you created that audience.
You can use your custom audiences in Google ads only if you have linked GA4 property with a Google Ads account (and you have also enabled Google Signals),
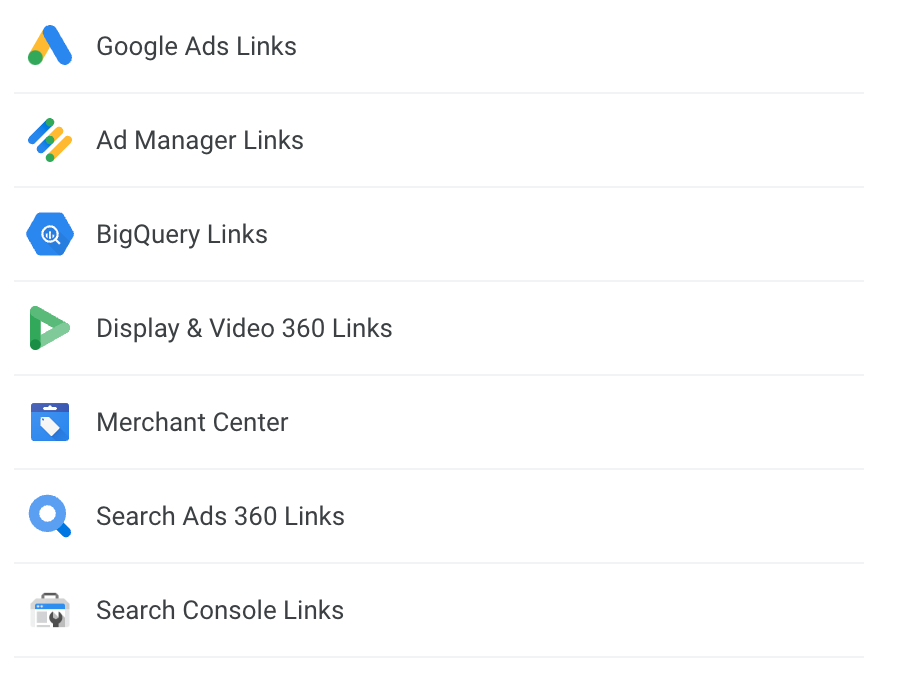
Integrations
For the time speaking, GA4 lets you integrate your analytics data to more than ten other tools, including some tools of its suite. However, GA4 is still under massive development, and we expect to have more integrations available soon.
These integrations mean that you can synchronize data between GA4 and another tool of your choice to make robust analyses and facilitate your decision-making process. For example, you can link GA4 with Display & Video 360 or Google Ads to see the entire student cycle, from how your future students interact with your ads to how they finally complete the Request More Information form on your site. You can also use your custom audiences for display/search advertising and synchronize conversions between two platforms.
To deal with the data retention limitations, you can connect GA4 with Big Query, and store all Analytics data in BIgQuery. Once you connect to Big Query, you are the sole owner of that data, which you can use to make further in-depth analysis and YoY comparisons. This is a paid tool, but its cost is super cheap. I have data assets that constantly process more than 1TB of data, and I have never spent more than $10/m. Yes! That’s how cheap it is.
If there is one recommendation I would make about integrations, is to connect your Analytics with BigQuery ASAP so you do not start to lose important data when you reach the data retention limit (which is 2 or 14 months, depending on how you configure it)
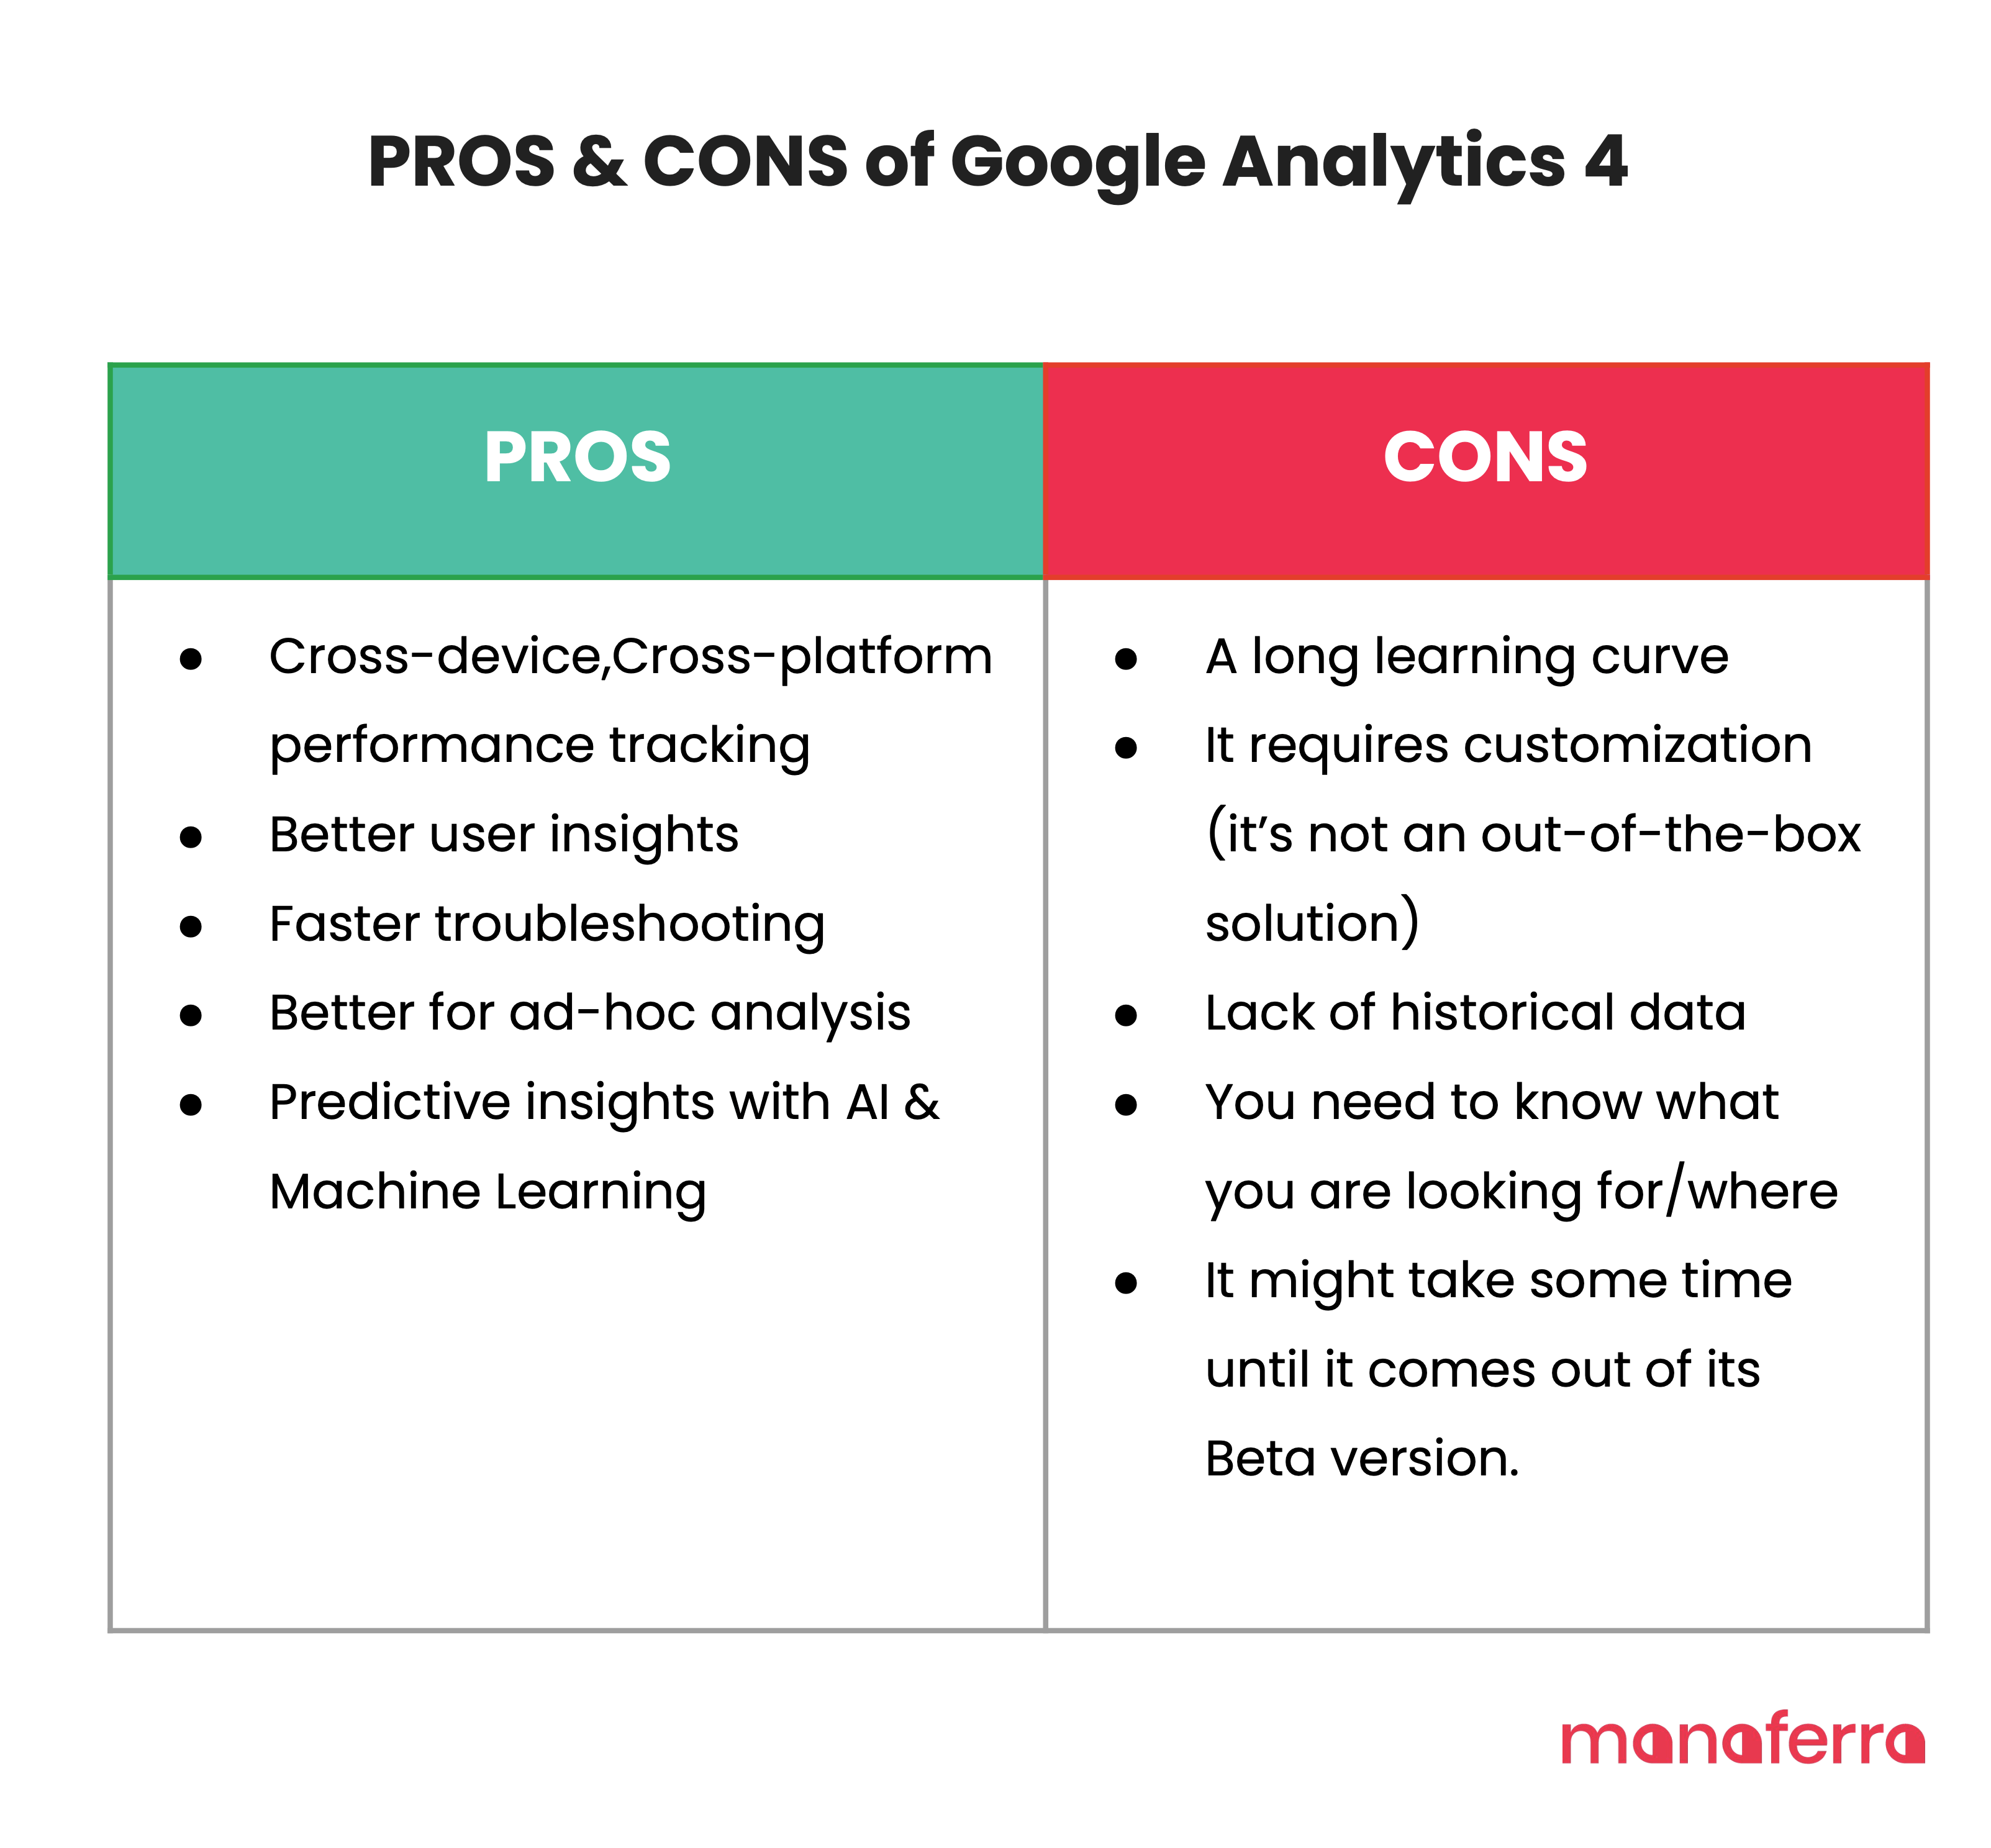
Pros and Cons of Switching to GA4
As with every tool out there, GA4 has its pros and cons. It’s a constantly evolving and improving tool that will take some time for you to adapt as a higher education marketer.
On the PROS side, this entirely new Analytics product outperforms its predecessor in many areas. Its extra layers of analytics capabilities are built for a world where data and marketing are increasingly crucial for the success of higher education institutions.
On the CONS side, there are some things you might need to consider before taking the next step of migrating to GA4. Because GA4 is built on a data model made for scalability and Machine Learning, it’s not an out-of-the-box solution that you can meaningfully use right away after you set it up. You need to tweak it based on your needs and build custom reports (most of the reports you are used to seeing in Universal Analytics do not come out of the box in GA4). You might need to be patient as you go through the learning period (it will take some time, trust me) and let the data flow within the tool, so you benefit from AI/Machine Learning capabilities of GA4.
Setting up GA4 for Universities
Now that you have a bigger picture of how GA4 works let’s dive deeper into how to set it up so your university can take advantage of all the new features that the tool offers.
If you are reading this post by the middle of 2022, the chances are that Google Analytics 4 is still not mature enough to be used as a standalone analytics tool. Hence, you should use both tools (UA and GA4) at the same time so you feed data into the GA4 ASAP, but at the same time, use the reporting you are currently using in Universal Analytics (so that you can make the transition easy for you)
However, if you are reading this post in late 2022 or even more in the future, it will probably be mature enough for you to switch to Google Analytics 4 completely.
UA will stop collecting new data from July 2023, so every day of not setting up GA4 means a day less with data you could use for analysis and decision-making. So make sure you are pushing data to your GA4 account ASAP. Otherwise, you will lose YoY data.
Let’s learn how to set up the GA4 account first.
How to set up a GA4 Account for my University?
There are two ways you can set up a GA4 account. One option is to create a whole new property (it will be a GA4 by default), and the other option is to use GA4 Setup Assistant. This time, I’ll focus on creating a whole new property because the result will still be pretty much the same, and I can walk you through the entire process.
Creating a new GA4 Property
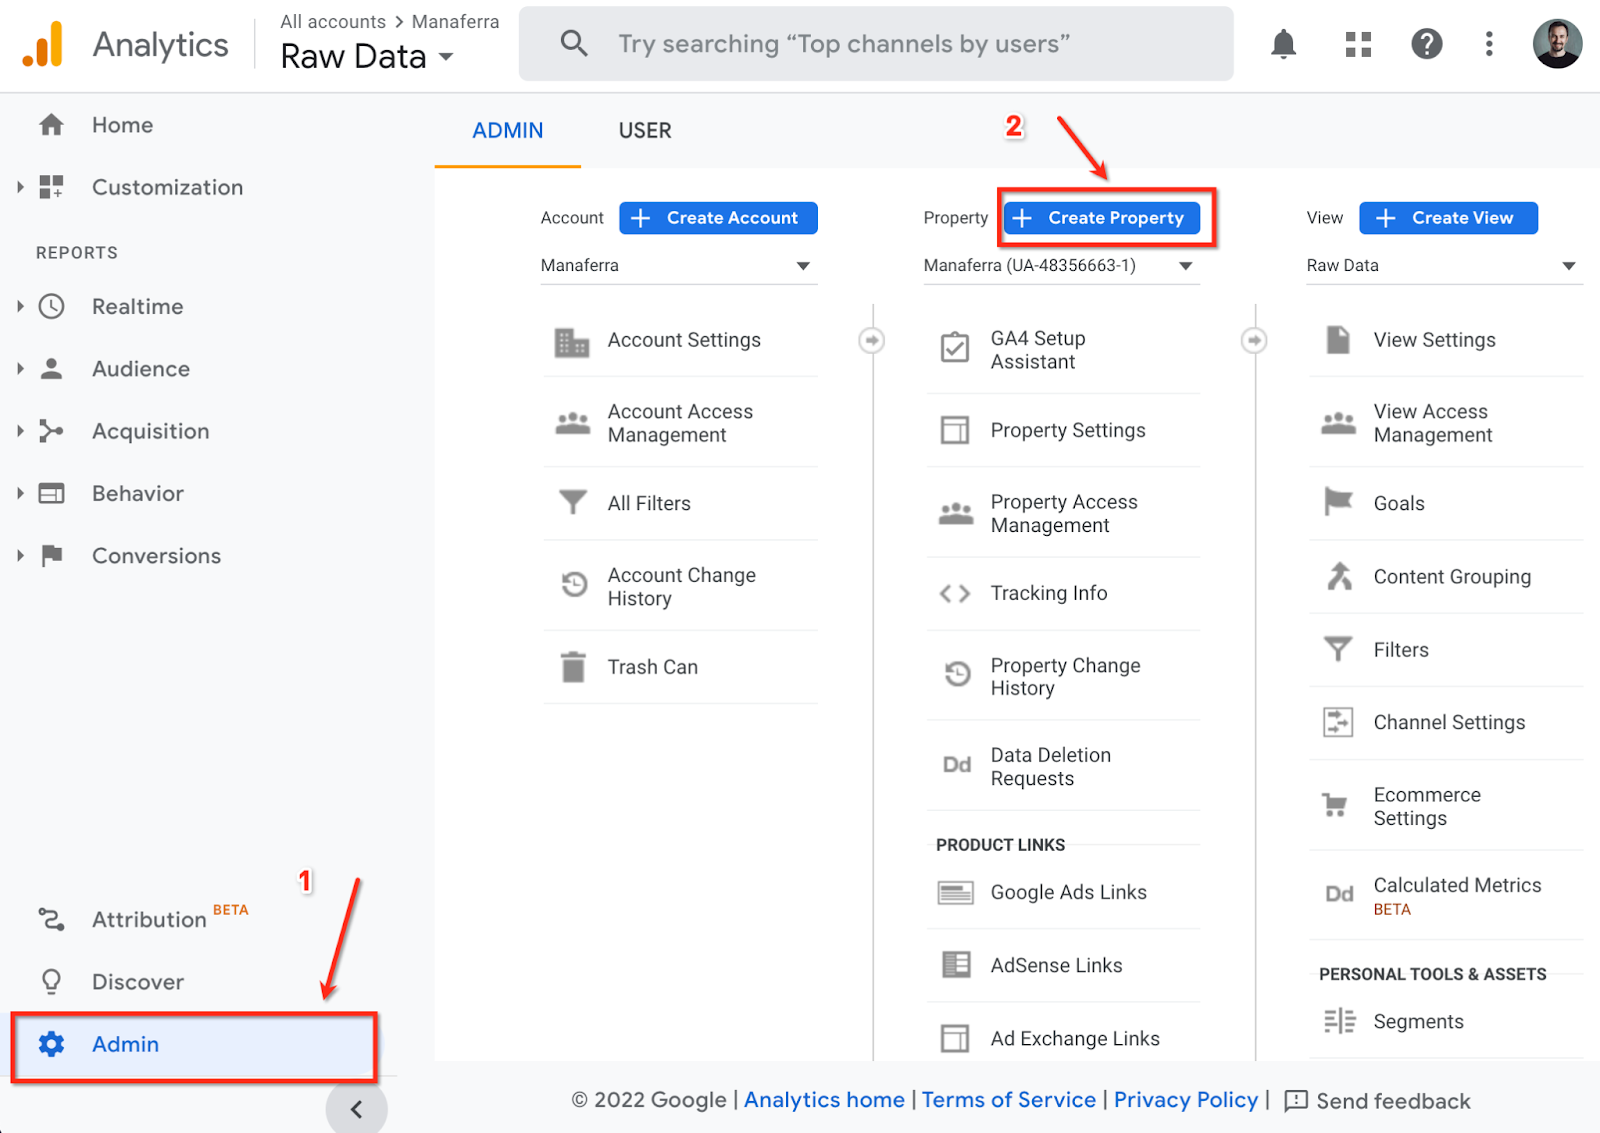
Go to the Admin section of your Google Analytics interface (by clicking the Admin at the bottom-left corner) and then (in the Property section) click Create Property.
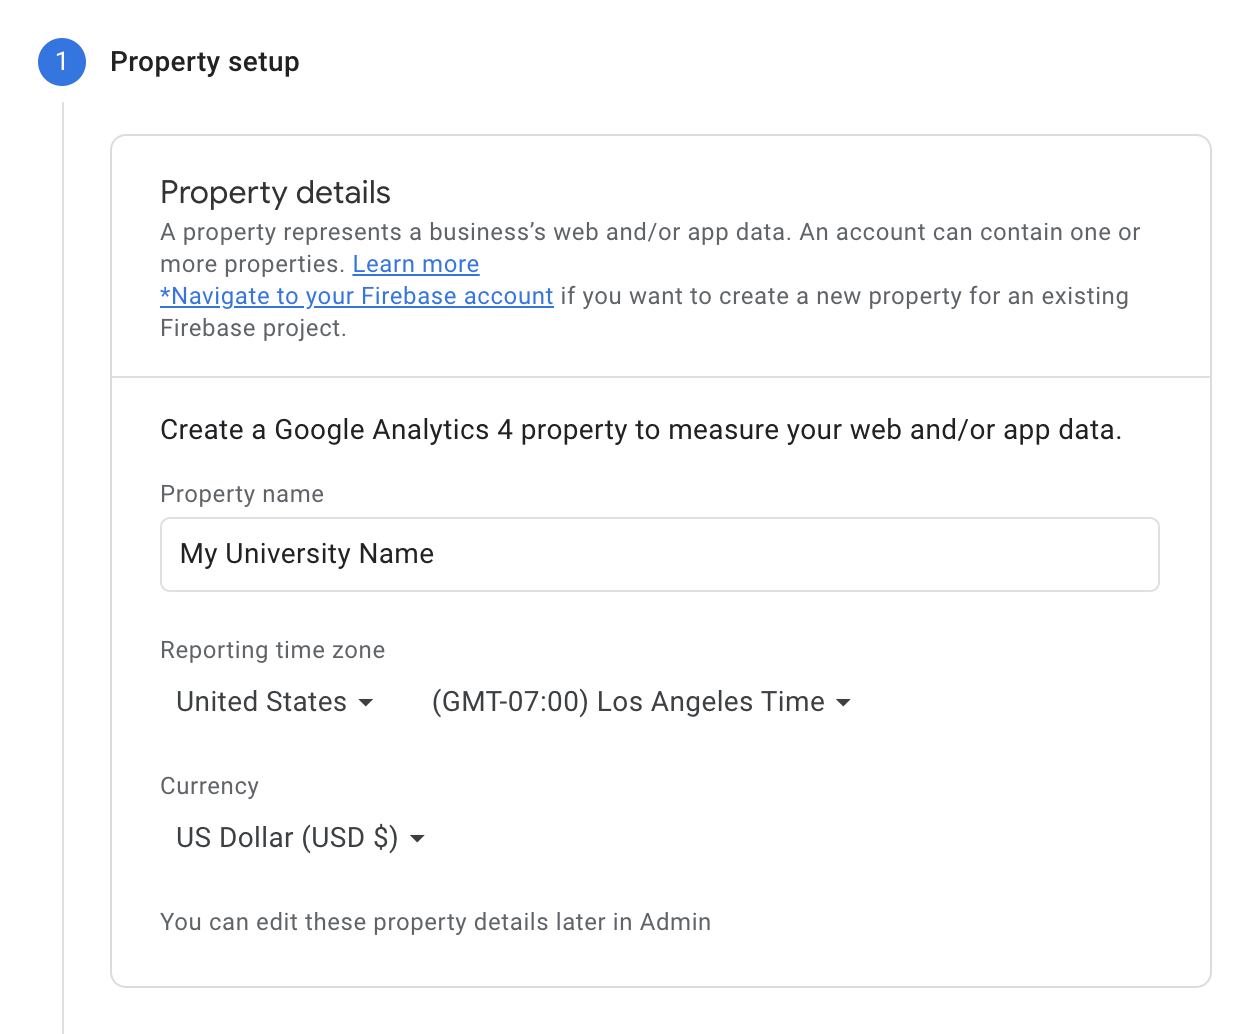
Then enter the name of your University, choose your University’s main campus country, reporting time zone, and the main currency your University operates in, and click “Next”,
Then, fill out your business information. Suppose you are a university of 11-100 employees. In that case, we recommend the following setup, as GA4 will adjust some configurations and enhancements based on the category of the business and the intent of how Analytics will be used.
Once you click “Create”, your GA4 property will be ready. However, there are still some setups you need to make to start using it.
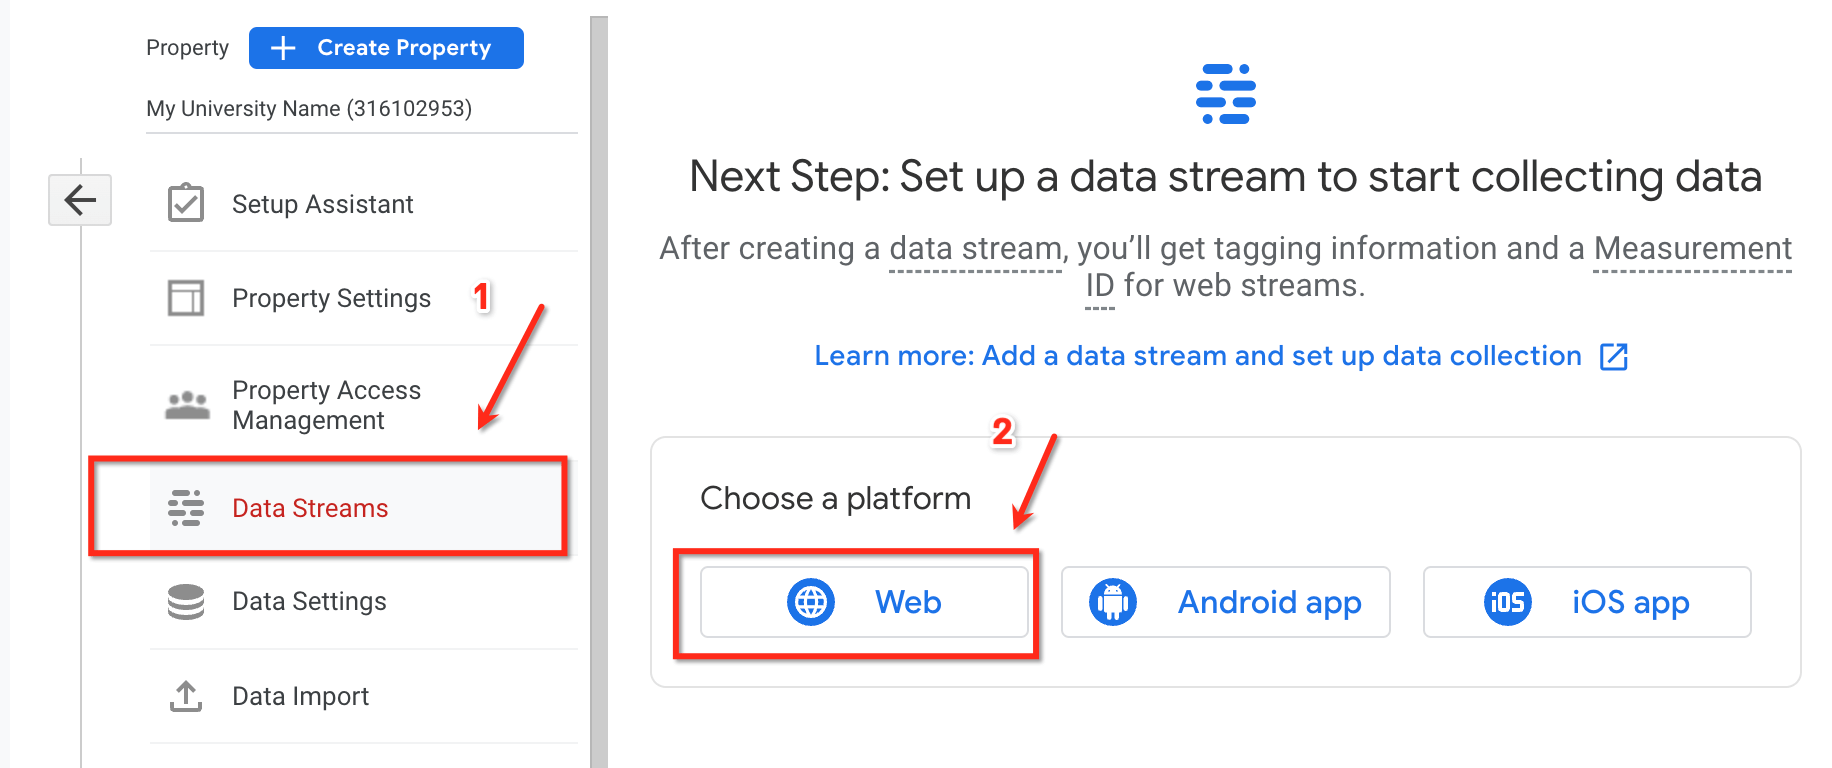
Data streams
The next step to complete is to configure your first Data Stream. This tells Google the data source from where it will get the data before sending it to your Google Analytics 4 property. You can have multiple data sources in a single property. For example, three web properties, 1 for the Web, one for an Android app, and 1 for an iOS app. However, for most universities and colleges, 1 Data Stream (web) will be enough.
While on the property that you just created, click “Data Streams” and choose “Web”
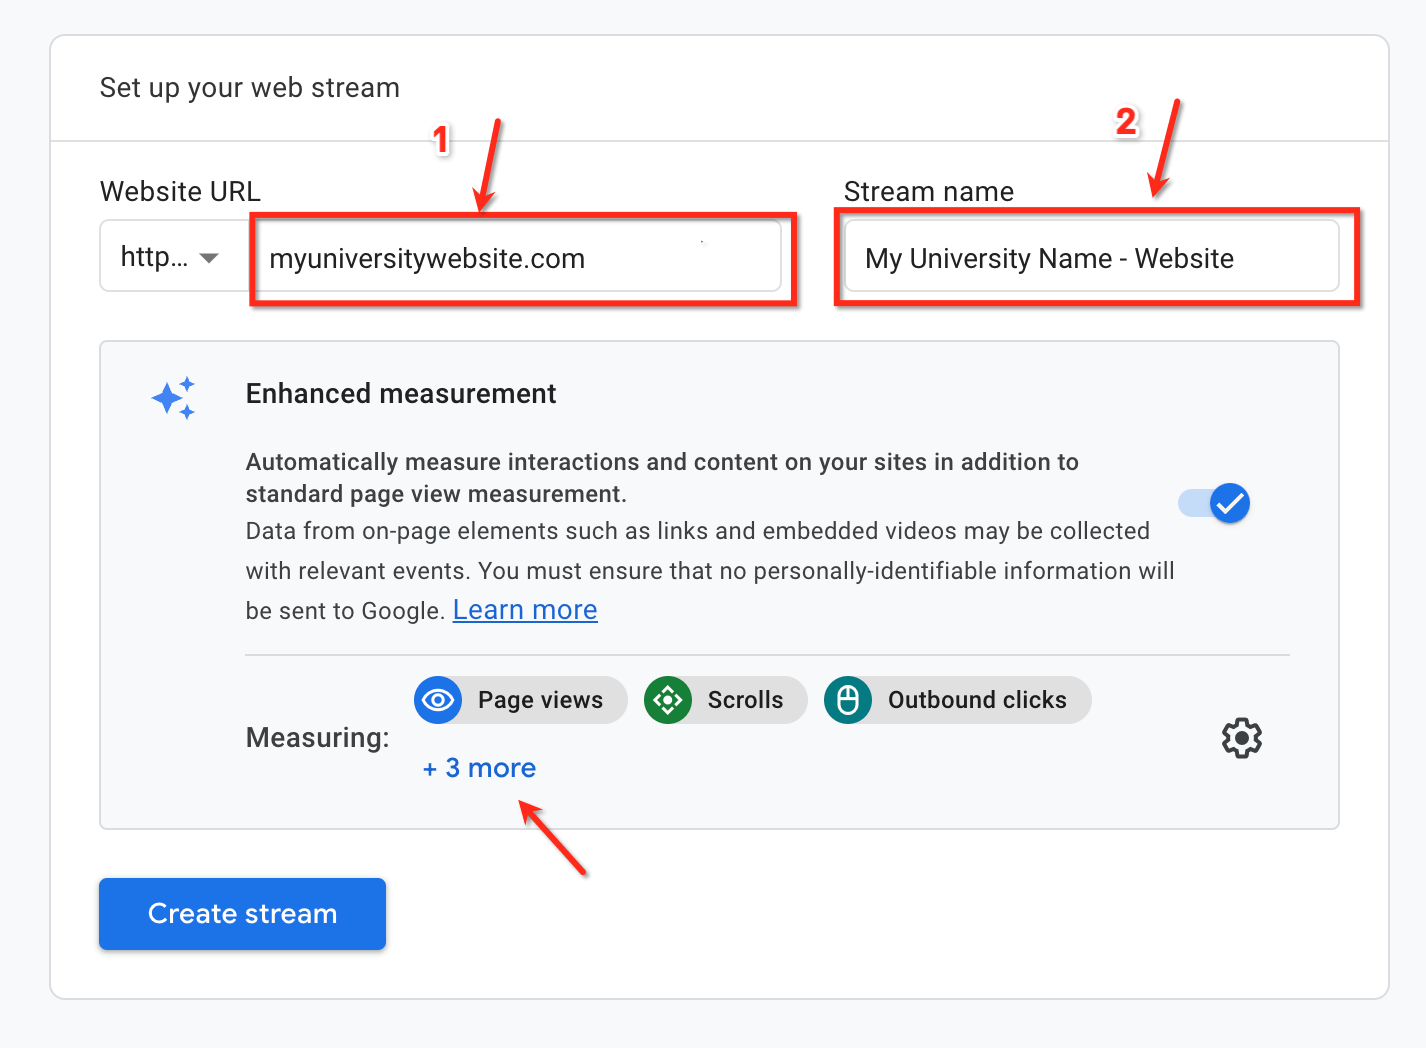
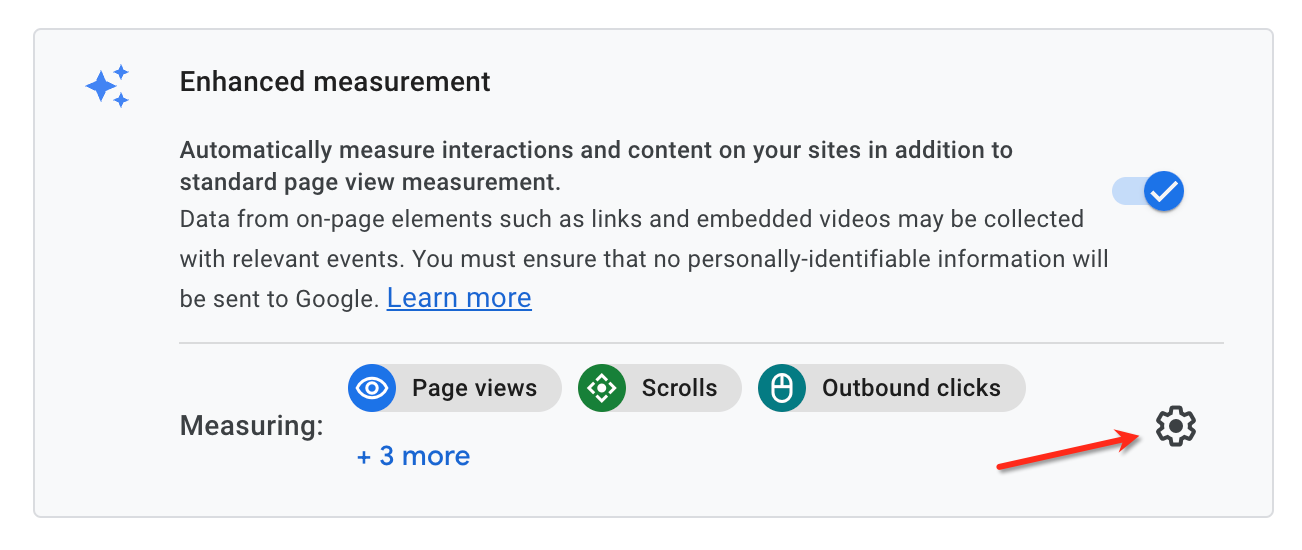
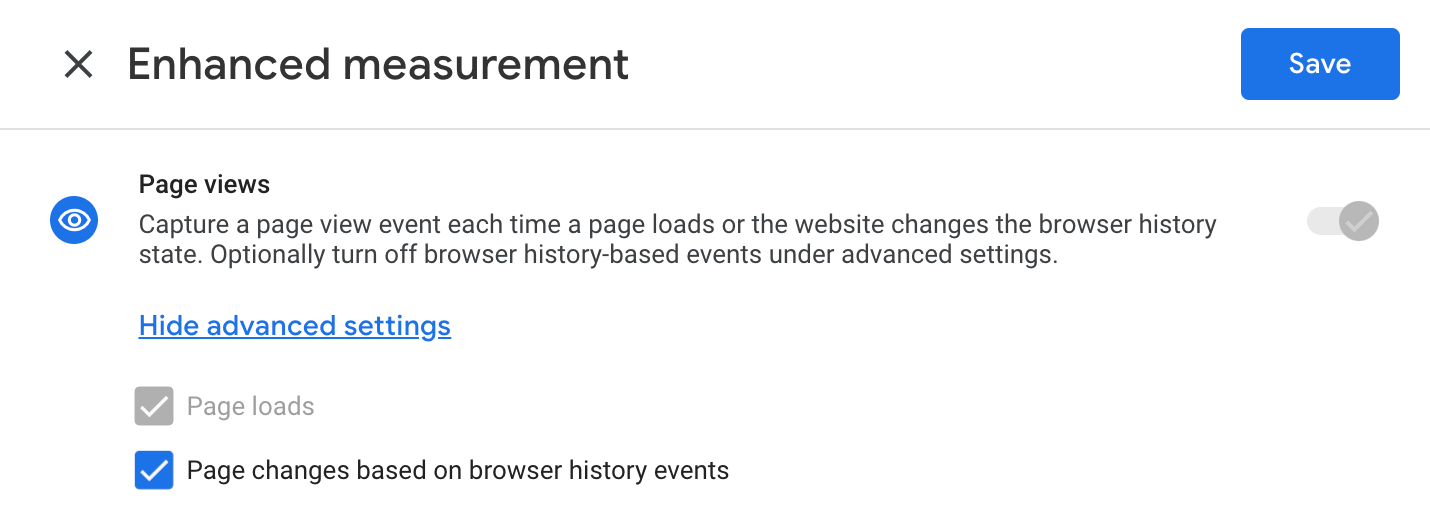
Once you enter your university Website URL and Stream Name (Example: My University Name – Website), you will be able to enable/disable default events that come as part of “Enhanced Measurement.” These out-of-the-box events that GA4 automatically sends to your data warehouse without requiring you to implement them via GTM or asking a developer.
When enabled (which is the default option), Enhanced Measurement will automatically track the following events for you:
Page view (event name: page_view)
Scroll (event name: scroll)
Outbound link click (event name: click with the parameter outbound: true)
Site search (event name: view_search_results)
Video Engagement(events: video_start, video_progress, video_complete)
File Download (event name: file_download)
If you prefer, you can enable/disable such events manually by clicking the gear button on the right bottom side of the gray widget
When you are done with the above configuration, click the “Create Stream” button, and you will automatically be presented with tagging instructions.
GA4 Tag Installation
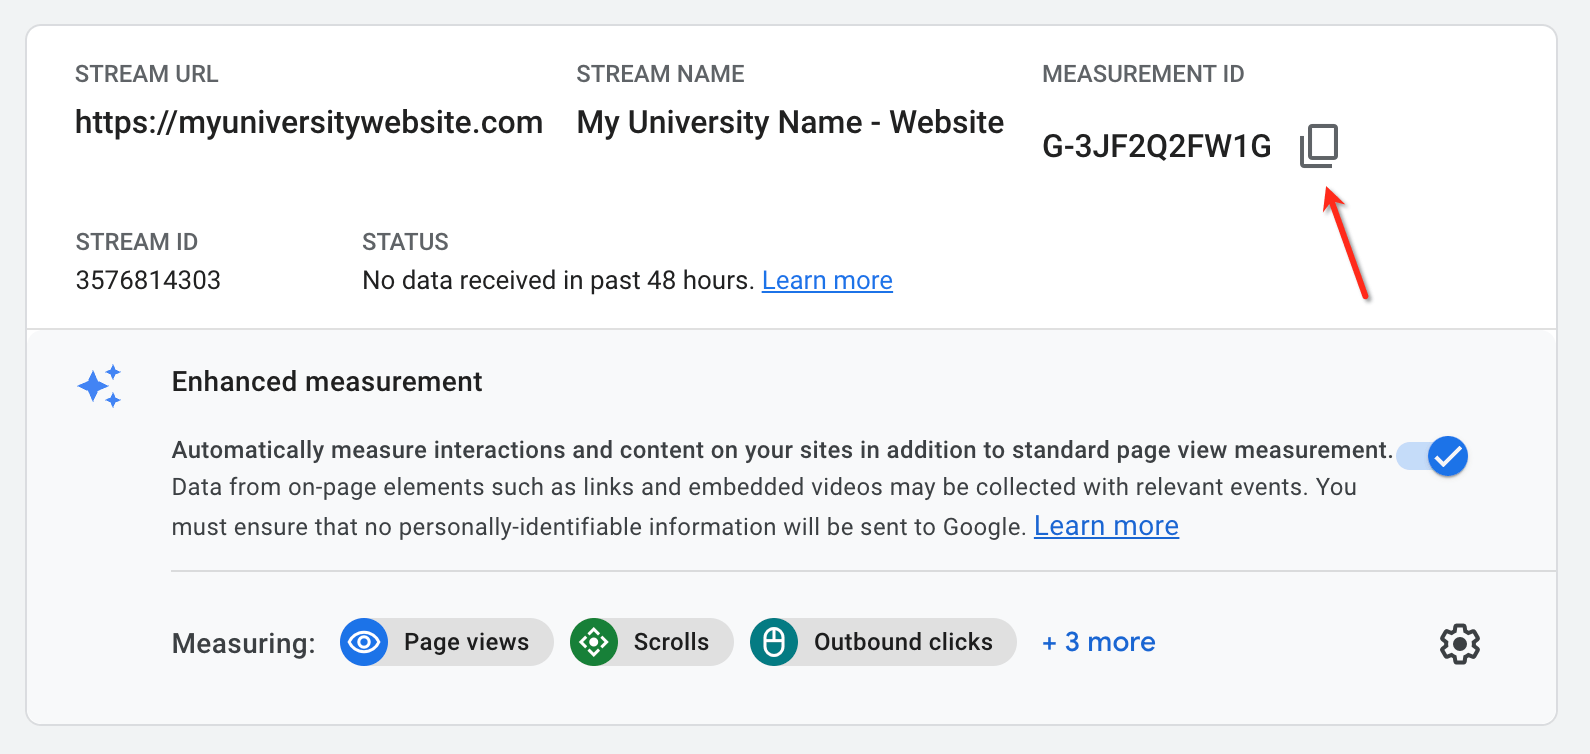
Each of your Data Streams has a unique “MEASUREMENT ID” that you will need to use to send data right into your Google Analytics account. You can install the GA4 tag manually on your website or use a platform like Google Tag Manager (our recommended way).
If you are doing this in 2022, MAKE SURE your Universal Analytics code is still running so you are collecting data for both UA and GA4 simultaneously.
Let’s see how we install GA4 via Google Tag Manager
Installing GA4 via Tag Manager
While on the Data Stream details page, copy the “Measurement ID” as you will need this to add to your GTM account.
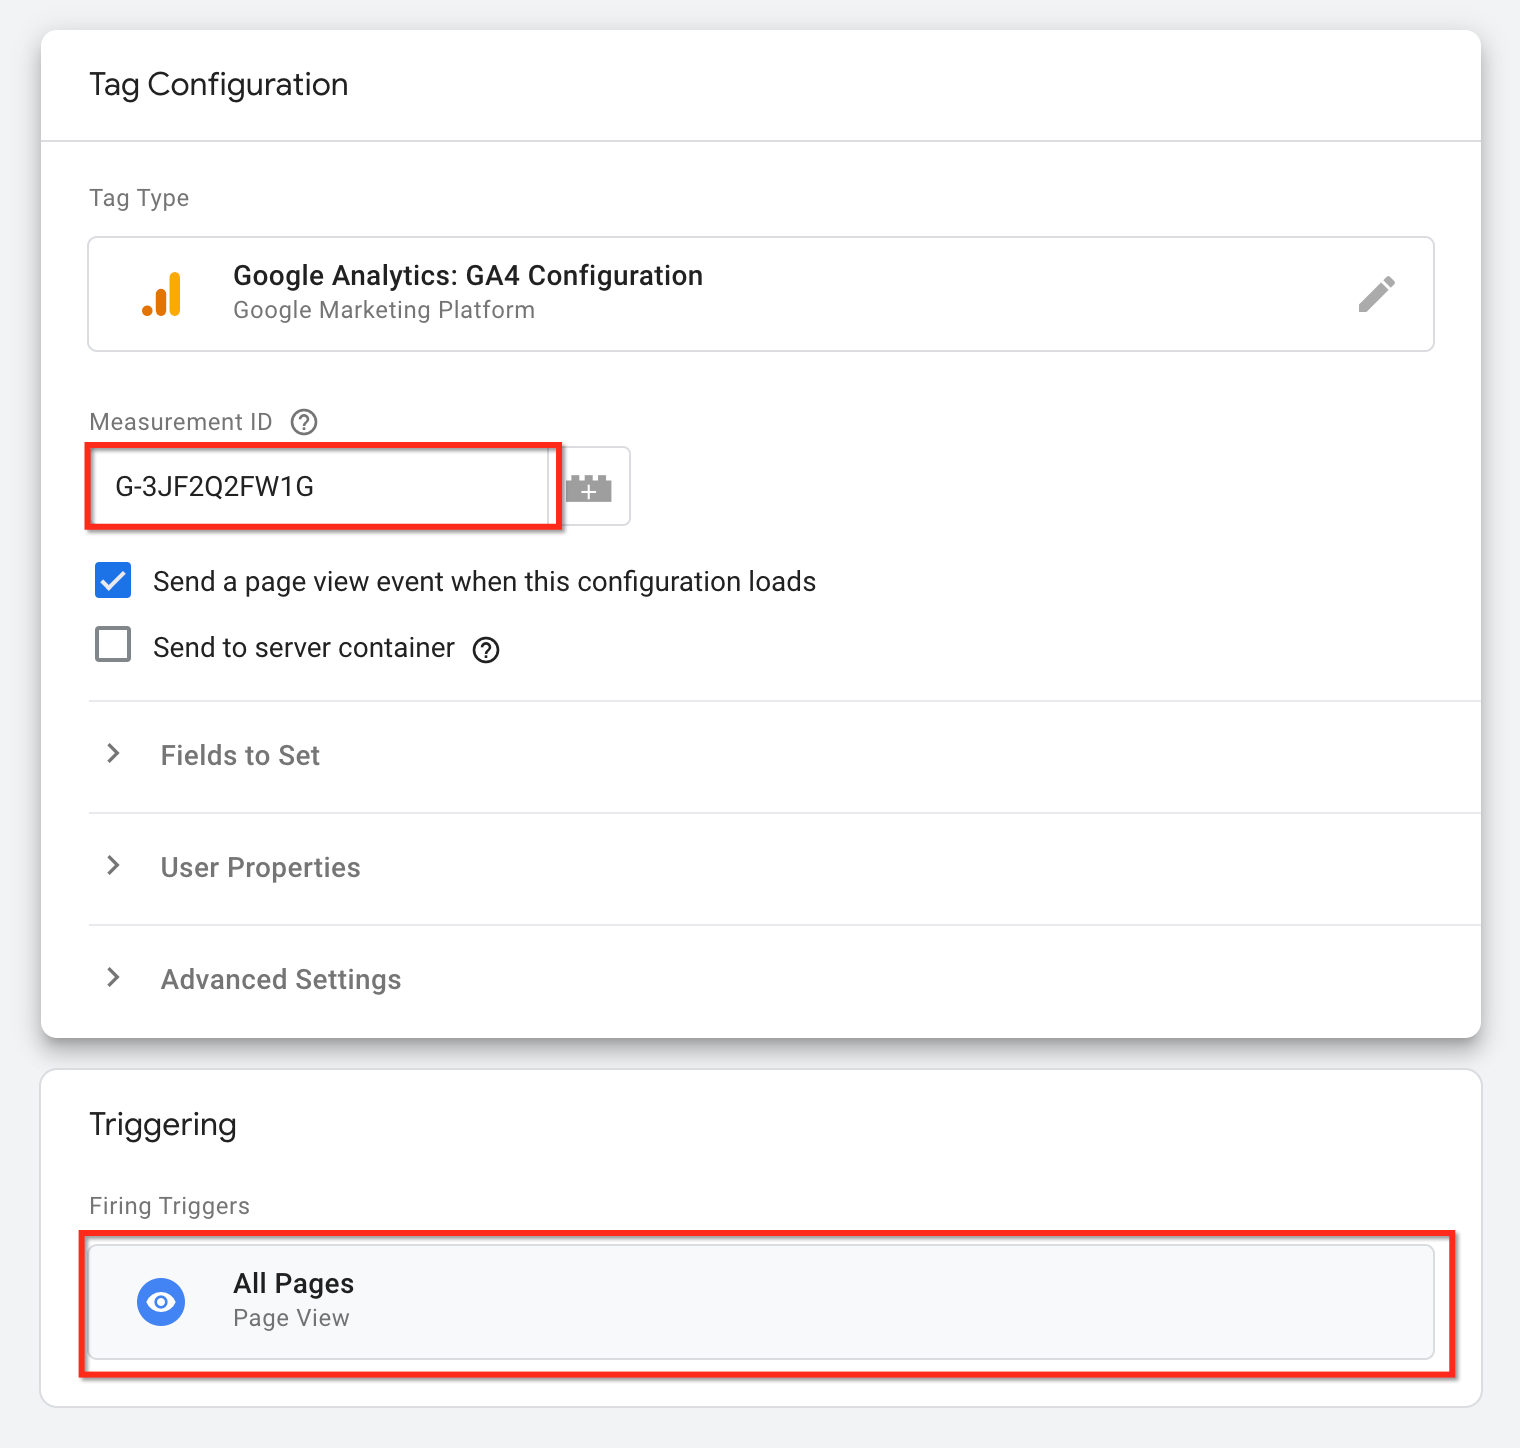
Go to your Google Tag Manager container, click “Tags” -> New” and on the “Tag Configuration” box, choose the “Google Analytics: GA4 Configuration.” tag.
Enter the ID ID in the Measurement ID field that you just copied in the GA4 interface. If you want GA4 to track pageviews automatically, keep the “Send a page event” enabled. If your website is built as a Single Page App (ask your developer), you might need to disable the “page_view” event as it will not get consistently fired on the user navigates on your site.
In the Triggering section, select “All Pages,” click “Save,” and then name the tag according to your naming convention: “GA4 Configuration – G-{your measurement id}”
Testing GA4 Integration via GTM
Let’s test our integration.
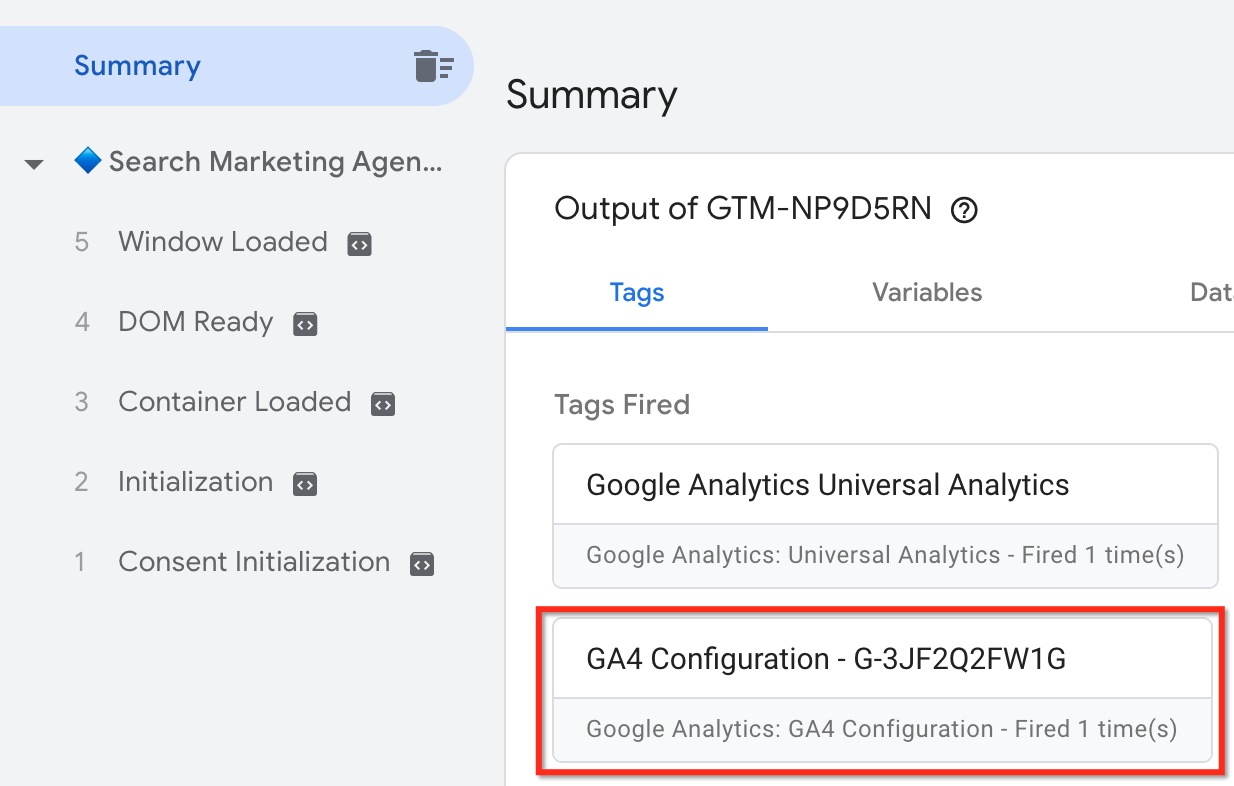
While on your GTM, click the “Preview” on the upper right side of the windows, and you will be able to enable GTM Preview mode to test the integration.
Once you type your website URL and click Continue, you should see the new GA4 tag among the fired tags.
Once you see your fire being fired in GTM Preview, ensure the event is being sent to GA4. You can test it by going to GA4 -> Configure -> “Debug View” and waiting for events to fire (you might experience some seconds delay until the data starts to appear in Debug View). If everything has been appropriately integrated, you will see something like this:
Once you ensure that the data is coming in and shown correctly in GA4, you should submit your GA4 changes in the GTM container and publish it.
Publishing GA4 Integration via GTM
To publish changes, go to your Tag Manager container, and on the top right side of the page, click “Submit”, type a version name of the deployment (optional) and a description of changes you have done (optional), and click the “Publish” button.
When you publish changes, you should soon start seeing data coming in your GA4 real-time reports.
Congratulations! You have just set up GA4 with Google Tag Manager. However, GA4 needs a lot of customizations, remember?
Installing GA4 on your University WordPress Site
There are two ways you can add a GA4 tag on your WordPress site. One is by placing a direct “gtag” code directly on the <head> HTML part of your website, and the other is by installing it via a plugin. Let’s cover both of them.
Installing GA4 tag code manually on WordPress
Go to your GA4 Property and click “Data Streams”, and choose the Website data stream you just created to get stream details.
On Tagging Instructions, copy the Global Site Tag and place it into the <head> section of your HTML code (you might need the help of a developer to do this)
Get started with GA4 for your website
Migrating from Google Universal to Google Analytics 4 is no simple task. Sure, account setup is relatively straightforward, but setting up the proper conversion tracking is much more complicated now. Google Analytics 4 has its advantages and disadvantages, but like all new forced changes, it will take time to get used to. Google Analytics 4 will actually be an improvement on your analytics data as it is based solely on events and parameters.
Let our team of Google Analytics 4 experts do the heavy lifting for you.
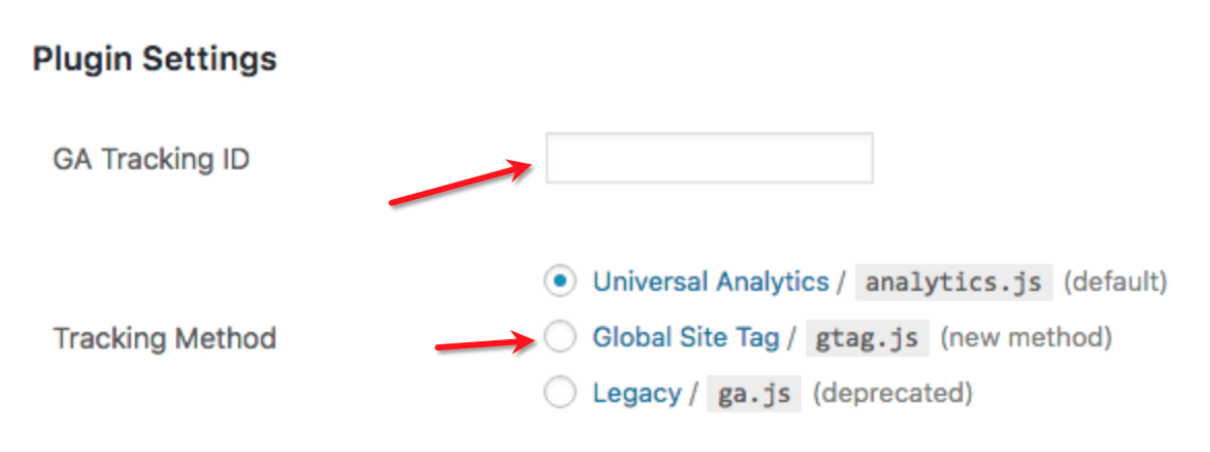
You can use multiple plugins to install the GA4 tag on your University Website. However, we recommend using the “GA Google Analytics” plugin as the most straightforward WP plugin to integrate Google Analytics into your WordPress website.
Once you install the plugin, go to its Settings page, add your tracking Measurement ID under “GA Tracking ID” select “Global Site Tag” and then click “Save Changes”.
That’s it! You have now installed GA4 on your WordPress site. Make sure you receive real-time statistics by going to your GA4 -> Home and see if your current traffic is being reported.
Installing GA4 on your University WIX Site
If you use WIX on your university website, you need to add your Measurement ID on your Marketing Integrations page. You can do it by following the instructions below:
Copy your Measurement ID under Web stream details.
Click the Show More icon in the top right corner of the page
Click Edit
Paste your Google Analytics 4 Measurement ID in the pop-up.
Click Save.
Congratulations! You have just installed GA4 on your WIX site.
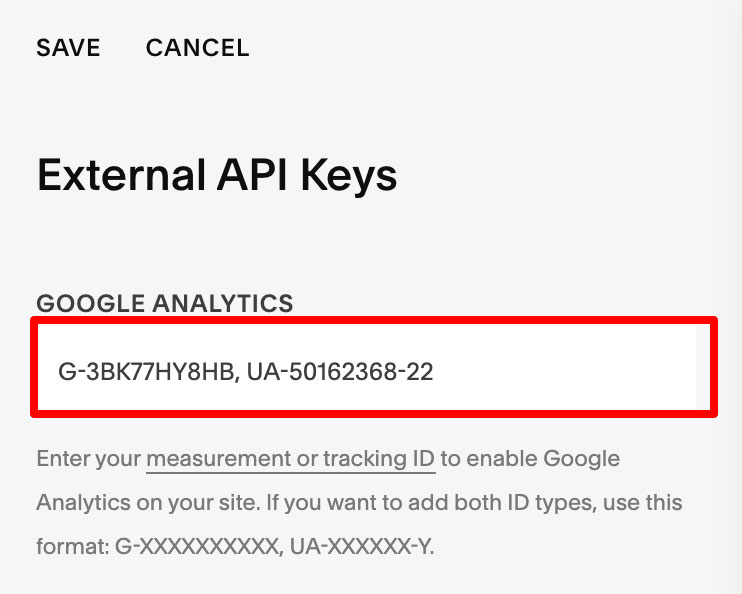
Installing GA4 on your University Squarespace Site
Squarespace has a built-in feature to connect GA4 without too much hassle.
To install GA4 tag on your Squarespace site, follow instructions below
Go to Settings
Go to Advanced
Click External API Keys
Paste your Measurement ID under the “Google Analytics” input
You can paste both UA and GA4 code on the same field, separated by a comma..
Test your installation by opening your website URL in a new window and opening the GA4 -> Home report to see your real-time statistics.
Filters
Filters in GA4 allow you to limit or modify the data before entering your Analytics account, and they do not work retroactively. Unlike Universal Analytics, where you could create a “raw view” account without filters and another one with certain limitations, filters on your GA4 are applied at the property level. As we are writing this post, there are no Views in GA4. That makes testing your filters in GA4 more critical than in Universal Analytics.
Currently, there are only two types of filters in GA4:
Developer Traffic
Internal Traffic
Filtering Developer Traffic
Develop traffic is the traffic generated by your website administrators/developers while developing or debugging the website.
This is done by adding a specific event called “debug_mode” or “debug_view” (with a value of 1) every time your GA4 code is executed during your developing/debugging sessions. You will still be able to watch that traffic coming through in Configure -> Debug View, but you will not be able to see it across other reports in GA4.
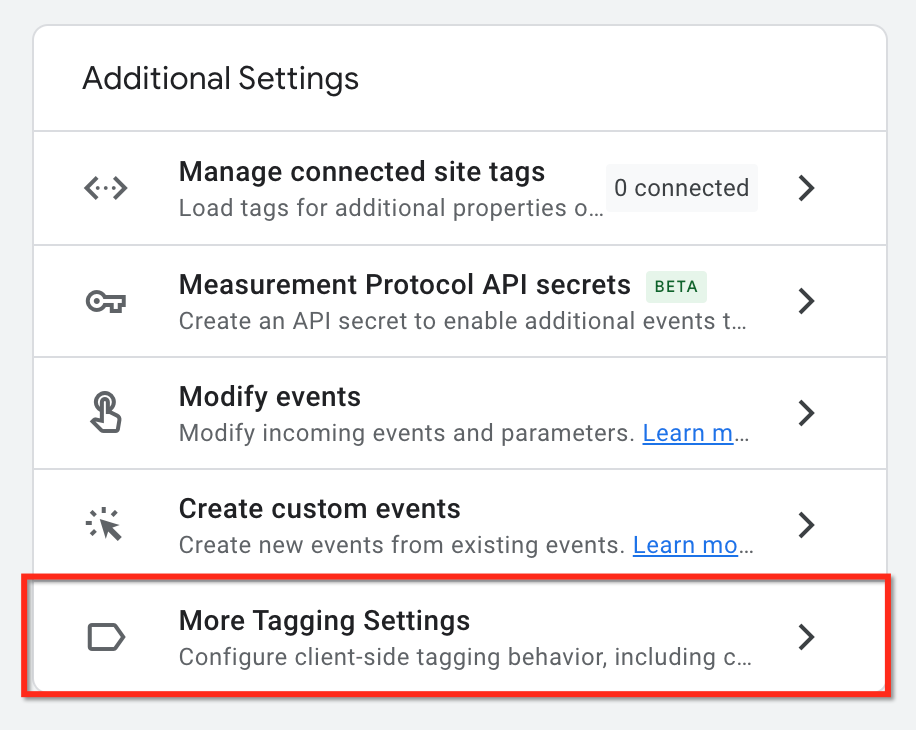
Filtering Internal Traffic
This is the traffic generated by people directly or indirectly connected to your university who are not your targeted audience. Those can include your faculty members, administrative staff, services providers, and vendors. As such, including their traffic in your Analytics can skew your analysis.
Currently, you can only filter your internal traffic by IP addresses (way more limited than it used to be in UA). To do that, you should:
Go to the Data Stream you previously created
On “Additional Settings”, click “More Tagging Settings”
Click “Define internal traffic”
Click “Create” Button
Add your IPs under “IP addresses” section and click “Create”
Events
Because of the way Universal Analytics was built and its data structure model, there were quite some limitations regarding data you could send via events (eg. only event_cateogry, label, and value). This made it challenging for higher education marketers to collect data across the whole student journey and analyze in-depth data on the scale.
This has changed, and Events are now the core of Google Analytics 4. But, before going further on events, let’s make sure we understand what an event is and how they work.
What is an Event?
An event is an interaction of the user with your Web or Mobile App. All interactions on your website/web such as clicks, visits, downloads, form submissions (leads), student applications [and more] are considered “Events”.
The data model of GA4 offers much more flexibility when it comes to tracking events and sending additional information with it.
In Universal Analytics, you could only send up to 4 event attributes of an event to Google Analytics:
Event Category (required)
Event Action (required)
Event Label (optional)
Event Value (optional)
As discussed earlier, everything in GA4 is considered an Event. Depending on your scenario, you can send up to 25 additional parameters with an event without limiting how you name them. For example, let’s say that a future student is reading a program page and decides to fill out a “Request More Information” form. You could send the following event:
event_name: lead
lead_type: request information
degree: bachelor of business administration
lead_palce: header
In_military: yes
The last four parameters on the list above are custom events you can send along with your event, which you can later use to do performance analysis on your Analytics account.
Apart from custom events, GA4 also comes with a set of default events and recommendations for you to follow. Let’s go through them and see how you can utilize them to structure your GA4 configuration better later on.
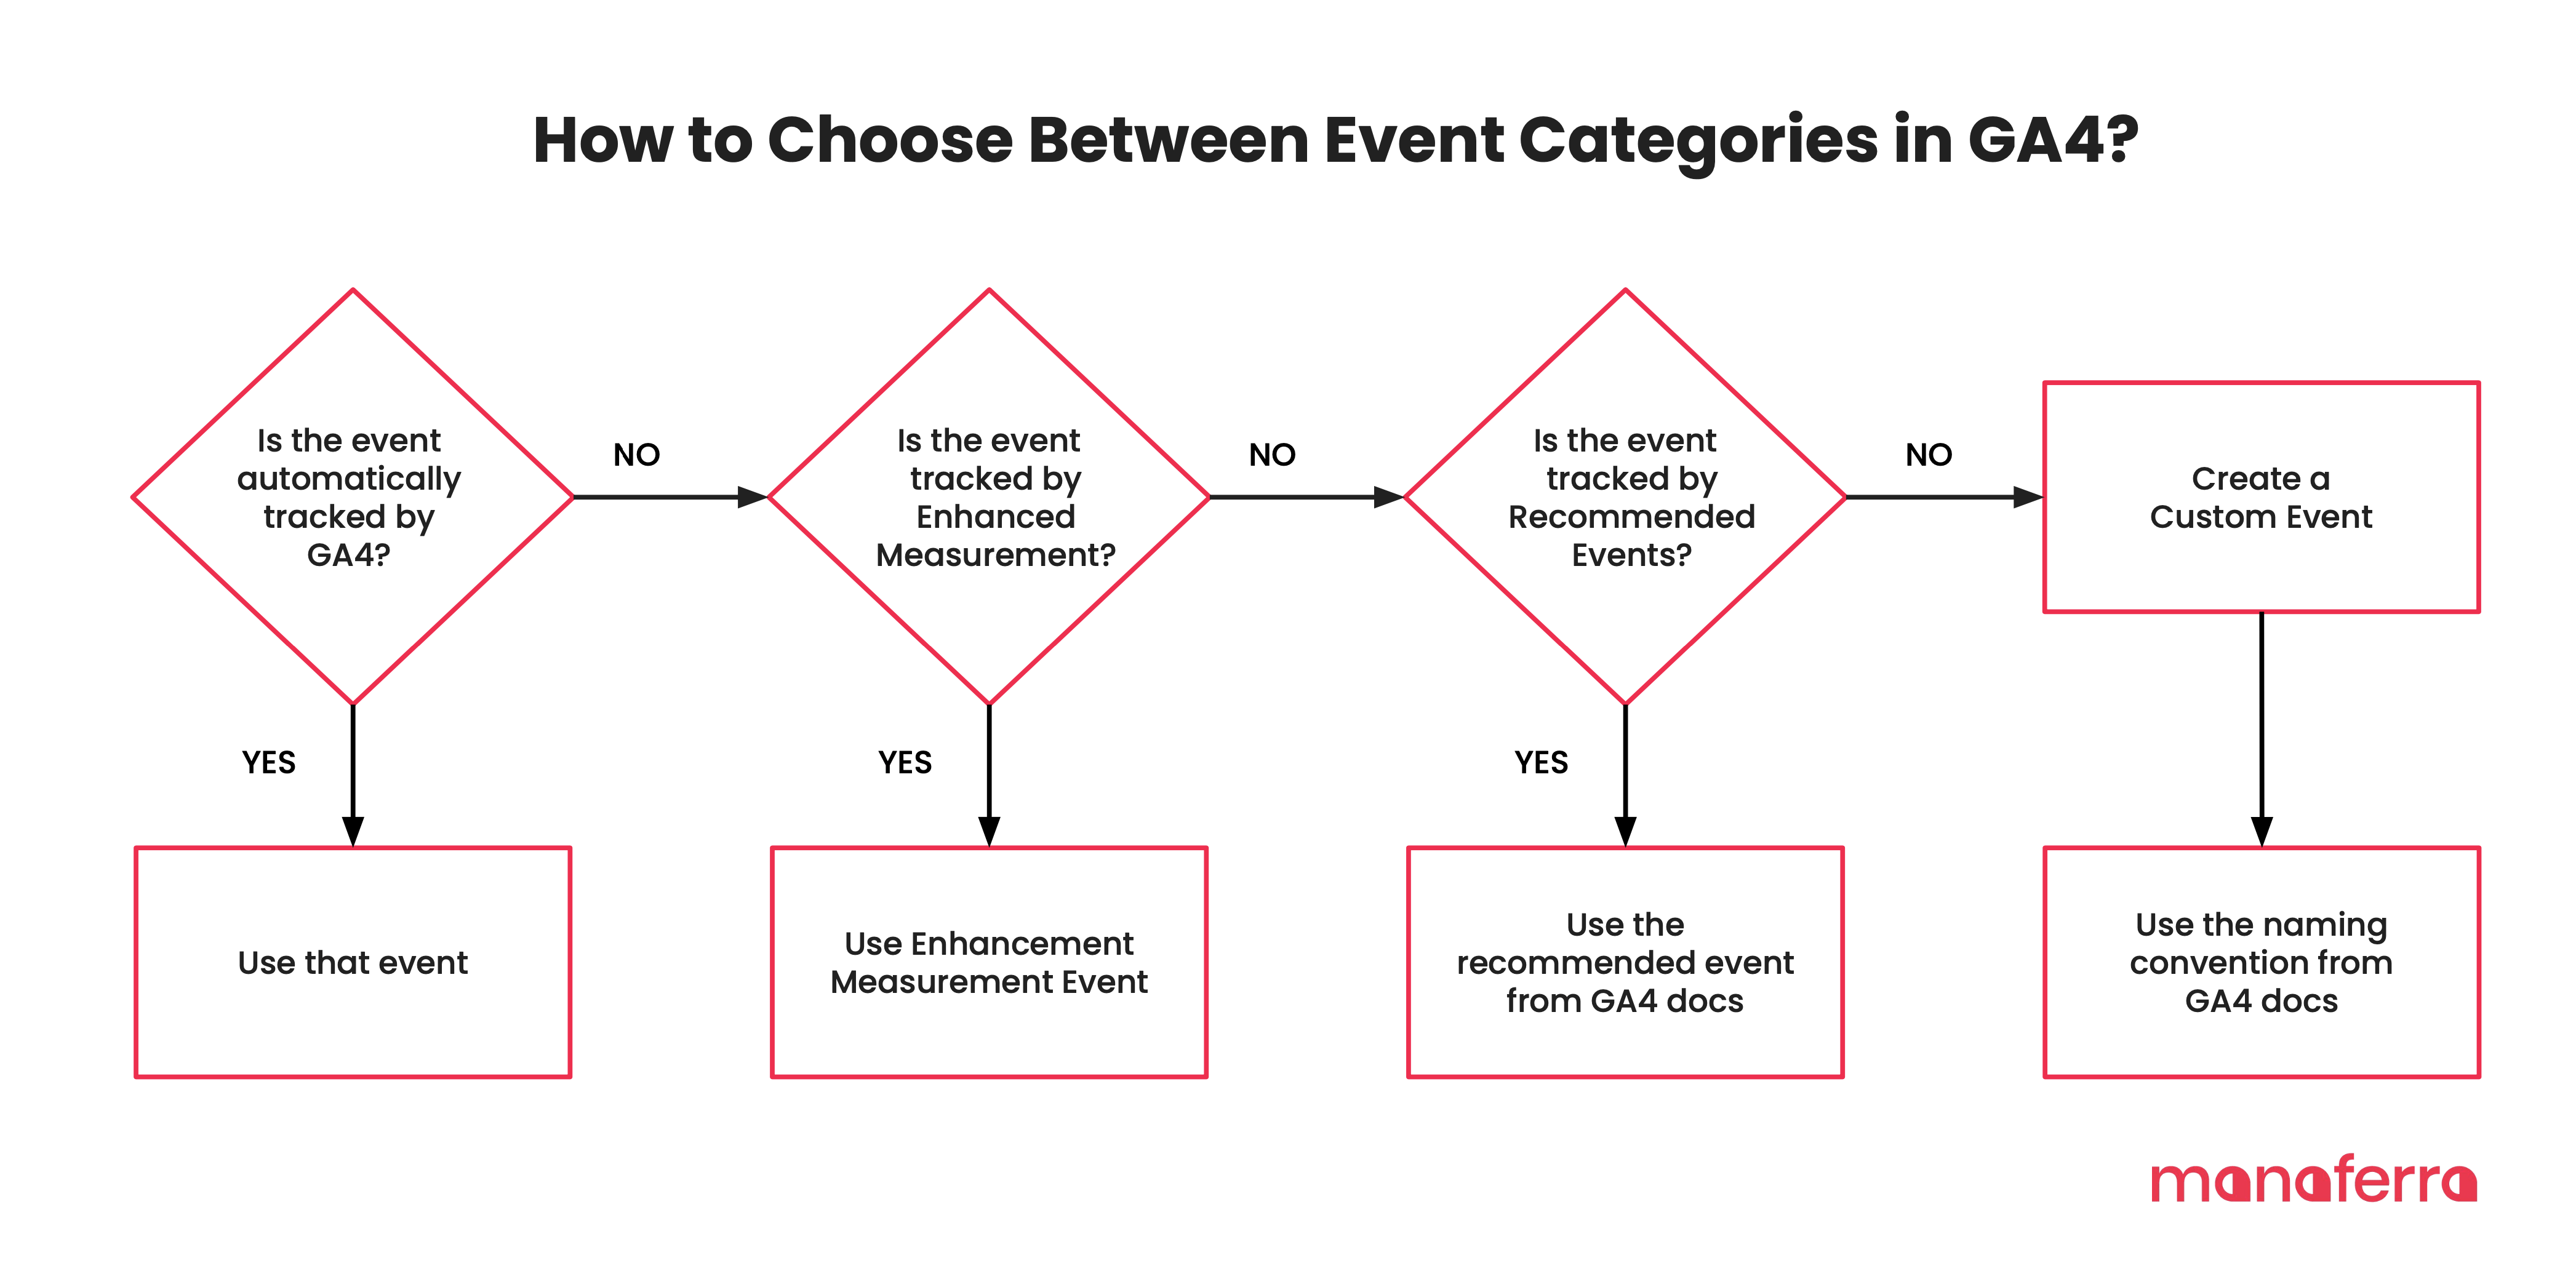
Categories of Events in Google Analytics 4
There are four categories of events in GA4:
Automated Events
Enhanced Measurement Events
Recommended Events
Custom Events
Here is how to choose between event categories in GA4:
Automated Events
Automatic Events on GA4 include interactions that Google must collect to perform its fundamental analysis on the tool. Those events are automatically triggered by GA4 itself on some predefined user activities. This includes session_start, first_visit, scroll, or user_engagement and other mobile app interactions such as app_update, ad_click, etc. You can get the full list here.
Enhanced Measurement Events
Those are additional automatic events by GA4, with the only difference being that you can enable/disable them on your property level.
You can enable or disable them (they come enabled by default) when you configure your web Data Stream in GA4.
When this feature is enabled, Enhancement Measurement will automatically track the following events:
Page view (event name: page_view)
Scroll (event name: scroll)
Outbound Clicks (event name: click with the parameter outbound: true)
Site search (event name: view_search_results)
Youtube Video Engagement (events: video_start, video_progress, video_complete)
File Download (event name: file_download)
You can enable or disable each one by clicking the gear button on the right side of the Enhanced Measurement section. Moreover, you can also customize some of them to fit your university website needs.
Page views:
This event is sent to GA4 when a new page loads or the URL of the page changes without reloading the page (a.k.a. history change events). Suppose your university website is built on SPA (Single Page Application), where your entire page doesn’t refresh when pages are changed. In that case, you need to ensure that your website is changing pages/URLs and changing the browser’s history events (you might need a developer’s help here).
Scrolls:
GA4 can automatically send events when a visitor scrolls below 90% of the page height. If you need to track scroll on a different scale, you might need to do that via Google Tag Manager manually.
Outbound clicks:
This event is automatically triggered when a user clicks on a link redirecting them to another domain. This is a great feature you can use to see which of the websites you have linked on your website content are helping your students answer their questions.
If your university operates in multiple domains, set up cross-domain tracking (via GA4 property > More Tagging Settings > Configure your domains) so clicks on your own domains are now considered outbound/referral links.
Site search:
This event allows you to track searches performed by your current and potential students on your university website. When enabled, it will automatically send a “view_search_results” event to GA4, if the page loads and the URL of the page contains a query parameter, such as q, s, search, query, and keyword.
If you are using WordPress for your website, there is nothing you need to change on the “Search Term Query Parameter” input, as the letter “s” will automatically get the job done. Otherwise, make sure you include your search query parameter on the configuration. For example: if your website search looks like https://www.my-university-webste.com/search?term=tuition-fees, you need to enter the word “term” as an option in the above configuration.
Video engagement:
This is built to track the user’s interaction with Youtube videos on your website. However, due to some technical reasons, this feature will not work by default unless your developer changes how those videos are served.
File downloads:
GA4 can automatically detect the download of files on your website and send an event when your link url contains one of the following extensions: .pdf, .xls, .xlsx, .doc, .docx, .txt, .rtf, .csv, .exe, .key, .pps, .ppt, .pptx, .7z, .pkg, .rar, .gz, .zip, .avi, .mov, .mp4, .mpe, .mpeg, .wmv, .mid, .midi, .mp3, .wav, .wma.
Once you’re done with all of the above configurations, click Save, and your GA4 will automatically start to track those events once you set up the GA4 tag on your website.
Recommended Events:
Those are events recommended by Google for different business categories but not enabled and configured by default. You will need to follow the recommended naming convention and set them manually on your web/app and Analytics to benefit from additional features Google may introduce to the platform.
If none of these we have previously listed in Automatic and Enhancement events doesn’t fit your needs, then look at the recommended events Google has published in its documentation. For the time being, Higher Education institutions can use the following recommended events based on their needs:
If you offer online classes where students can purchase online, then use respective events from the “Online Sales’ category
If your students cannot purchase your classes online, we recommend using the “generate_lead” event to track “Request Information Form” requests.
You can also use other events as you see fit.
Google recommends that you implement their recommended events when it makes sense for you because it can use those them to better understand your web/app performance during its Machine Learning analysis.
FREE RESOURCE
Download Our Free Step-by-Step Guide to Setting Up Google Analytics 4 for Universities
Learn what you need to know, from migrating your UA data to configuring conversions and filtering
If none of the previously discussed events fit your needs, you can create custom events. They work pretty much as the above events; however, they are some things you need to consider before deciding to use custom events:
You would need to create them manually
They do not show on standard reports.
It’s recommended that you use the same naming convention
For the time being, GA4 does NOT allow you to edit or delete your custom events. So make sure you have a thoughtful events strategy in place before reaching out to the 500 unique event limit
Let’s see how a higher education institution can use custom events to measure its marketing performance.
Tracking Conversions on GA4
Before going further, let’s set the table about what a Conversion is for a Higher Education Institution.
A conversion is a significant interaction you want your visitors to complete on your website. That can be a micro-conversion, a Conversion that puts your visitors one step closer to the main (macro) conversion (such as subscribe, download, chat discussion), or a macro conversion, a final conversion on your website (such as leads or student applications).
By tracking these conversions (and others), you are in a better position to measure the performance of your marketing activities and make decisions based on data.
In GA4, you can, for example, create a segment of visitors who have read a page about a certain degree who didn’t request more information and then use custom dimensions to understand their behavior compared to the ones who converted.
Now, In Universal Analytics, you used to track conversions by setting up Goals. You may have had a thank you page for your Request Information Forms and used that page as a trigger to create a goal.
In GA4, all conversions are tracked via Events. So, before a Conversion becomes “a Conversion”, it has to be an Event. You can use a pre-defined conversion event (such as “generate_lead”) or create a custom Event and mark it as a conversion by going to Configure > Events and marking a specific event as Conversion.
Alternatively, you can go to Configure > Conversions, then press the New conversion event button and enter the event’s name, for example, application_submitted.
Once you do that, wait for up to 24 hours, and you will start seeing conversion data in the list of all Conversions.
When it comes to tracking conversions for Universities and Colleges, here is a list of events that we recommend creating and marking as conversions:
generate_lead When a potential student submits a Request More Information form
application_view When a potential student views the application form
application_started When a potential student starts to fill out the application form
application_submitted When a potential student submits the application form
GA4 Tracking Strategy for Higher Education Institutions
The ultimate goal of events is to take action. If you have an event or metric on Google Analytics for which you cannot answer the question, “If I have this information, I could do this” then the chances are that you are using a vanity metric, and you won’t be seeing value out of it.
When it comes to deciding what metrics are essential for your university to track, it might be necessary to take a step back, look at it from a broad marketing and business perspective and ask questions like:
What problem am I trying to solve?
How does my Google Analytics fit with my overall marketing strategy?
Do I have the necessary infrastructure to measure what’s essential for my school?
Do I clearly understand my student’s journey and conversion funnel?
How can I use Google Analytics to link my marketing investment with actual Return on Investment?
Once you answer these questions, it might be time to start thinking about how you can translate them to concrete actions on Google Analytics. Using a framework like QIA to identify the right metrics for your school can be helpful. Start by asking these three questions:
What Question do I want to answer?
What Information will I need to get the answer?
What Action will I take based on the answer I get?
Let’s take an example of a scenario many higher education marketers face: What is the conversion rate of students for each channel? (Q)
You would need to figure out what information (I) you need to answer that question. In this case, you would need:
Student conversion data
Conversion data for each step of the decision-making process (TOP, MIDDLE, BOTTOM of the funnel) for each channel
Is that information already stored? Do I need to track it and keep it in Google Analytics? If you don’t have funnel conversion tracking set up, for now, you might need to add it to your @todo list.
Great! Now that we know what information we need, let’s decide about the most critical part of the framework: Action (A):
How will the answer be presented? How will the report look? Who is the report built for? What format do they prefer?
“What actions will I take if the answer is ‘X’?”
“What actions will I take if the answer is ‘Y’?”
You will need to plan actions based on answers to these questions. For example:
“If the conversion rate from Organic Search is 2% or higher, we’re doing well. If it’s lower than 2%, we’ll re-evaluate funnel pages, the effectiveness of the call-to-action and the SEO strategy to see how we can improve it”.
Answers like this will help you build an action plan with specific actions on implementing this tracking strategy, from defining events to conversion, account setting, and reporting.
Reports in Google Analytics 4
Reporting in Google Analytics 3 takes another level due to the flexibility of its data model.
In Universal Analytics, you have had numerous ready-to-use reports that, even though you might have found practical, were very limited in capabilities and pretty much the same for everyone.
While you now have much fewer ready-to-use reports in GA4, its flexibility in adapting and creating advanced custom reporting based on your needs is way beyond what we are used to seeing in the previous version of Analytics.
Reporting in GA4 is divided into two sections, which can be found on the main left navigation
Default Reports
Explore
Default Reports
Google offers numerous default reports on GA4 to help you kick off analysis faster. However, to fully utilize the benefits of the tool, you might need to customize such reports based on your use cases and needs.
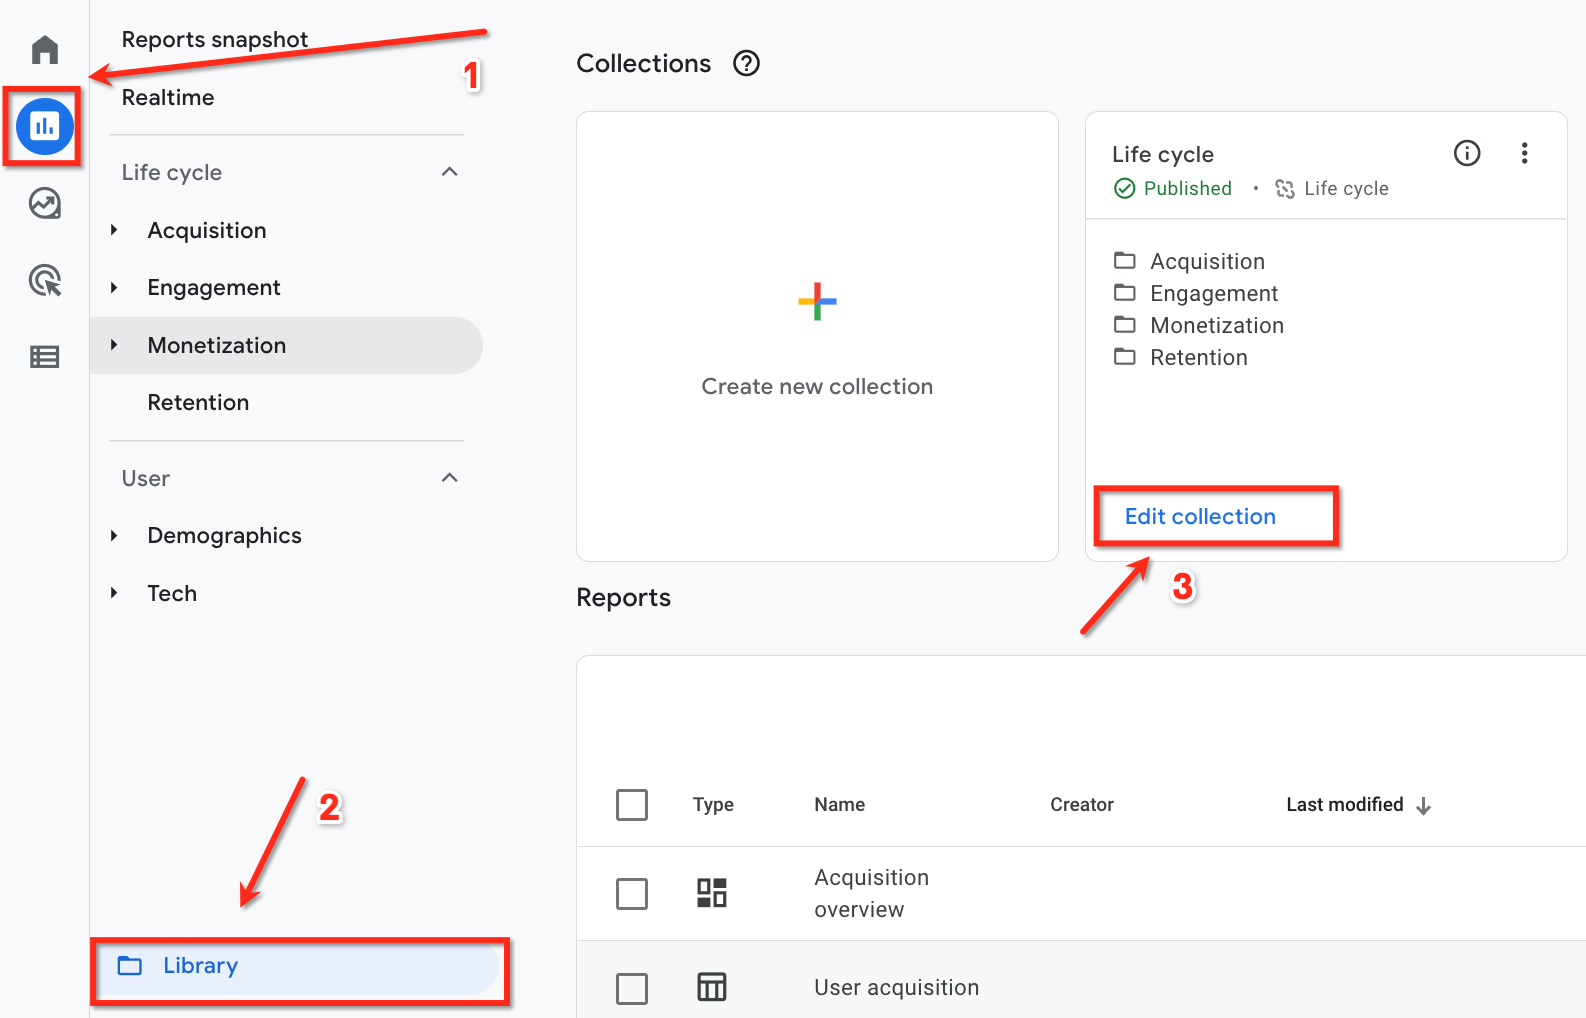
For example, if you do not directly monetize your university website, you don’t need to see the monetization charts on your reports. You can go to Reports > Library > Edit Collection and then remove/add the necessary report from the main navigation.
While on Library, you can add two types of new reports: Overview and Detail Report
Overview report: A dashboard (comprising a set of cards) that summarizes a detailed topic report (A topic can have only one overview report.)
Detail report: This can have up to two visualizations and a table with dimensions and metrics.
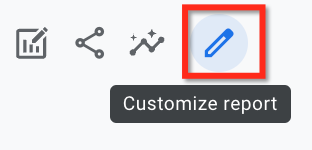
You can also customize individual reports only to show what’s important for your university. You can do that by going to a specific report and clicking on the “Customize reports” icon on the top right side of the page. From there, you can add/remove cards (widgets) and set dimensions/metrics as per your needs.
As you can see, there are certain limitations on the number of widgets, tables, and customizations you can make on default reports, and that’s where custom reports come in.
Exploration reports (Custom Reports)
Exploration is one of the best features of Google Analytics 4. It’s a collection of advanced techniques of analysis that can help your university create advanced reports and reveal deep insights about your future students and their behavior.
You can access exploration reports by going to the main navigation and clicking on Explore. You can create a fully customizable report (if you are short on time or now sure how to start), or you can use built-in templates.
Let’s explore some of the built-in templates, so you can have a better understanding of their benefits.
Free form
Use this template to find out more about your website visitors. You can visualize data in a table or graph format, use multiple dimensions, segments, and metrics, and compare.
Funnel Exploration
This template is pretty helpful for visualizing the steps your students took before converting to a lead or application as part of a pre-defined conversion funnel.
Path exploration
Use this template when you want to discover your students’ interaction toward a conversion. You can also do a reverse analysis and find out what your students do before converting.
Segment Overlap
This template allows you to show and compare the relationship between (up to 3) segments.
The learning curve to creating custom reports may be long for many higher education marketers. However, once you go through built-in templates and do some trial and error, you will start discovering new insights that will lead you toward better decision-making.
Final words
Now that you know the main differences between GA3 and GA4, you’re better positioned to migrate your university website from Google Analytics 3 to Google Analytics 4.
GA4 is an entirely different beast from its predecessor. It’s more flexible, more powerful, and more capable of making data-driven decisions. However, it’s not a simple migration process; you need to make sure you are making the right strategic decisions before starting the migration and have all the necessary information to set it up for success.
If you are just starting with GA4 in general and you are not sure where to start or how to properly migrate your university website to GA4, feel free to reach us, and we will be happy to help.
Get started with GA4 for your website
Migrating from Google Universal to Google Analytics 4 is no simple task. Sure, account setup is relatively straightforward, but setting up the proper conversion tracking is much more complicated now. Google Analytics 4 has its advantages and disadvantages, but like all new forced changes, it will take time to get used to. Google Analytics 4 will actually be an improvement on your analytics data as it is based solely on events and parameters.
Let our team of Google Analytics 4 experts do the heavy lifting for you.
Choosing a higher education institution is a pivotal decision, and a growing number of students in the US are starting to research their options months—sometimes years—before enrolling. Every time prospective students go online to research, higher education marketers have a massive opportunity to show up with relevant digital content and help them make a well-informed decision.
Students now research almost entirely online
Finding the right institution used to involve campus visits and flipping through stacks of brochures, but students today increasingly choose to spend their time researching online, bouncing between devices. In fact, 97% of students in a study done by Google researched their options online. Search was a crucial resource for most of these students, with 65% using a search engine at some point during their path to purchase.
Interestingly, students were more certain about their choice of coursework than about their choice of institution when they started their research—72% of students started with a specific course in mind, while only 36% were sure of their provider of choice. When they’re ready to learn about an institution, students get the bulk of their information from providers’ websites. A site full of helpful information is paramount, but an institution’s search performance is still a top factor: 45% of prospective students reported that they have a better opinion of universities that appear on the first page of search results.
Your higher education institution might offer excellent study programs, with some of the best professors in the field and superb facilities to accommodate students. But, if the school’s site doesn’t appear in the first few rankings of relevant search results, it’s less likely that students will ever see it while searching for suitable programs and, therefore, not be aware of all you have to offer.
Google is by far the dominant search engine, with an impressive 87.72% of all searches in the U.S. happening on it. So, higher education institutions can significantly benefit from the increased visibility of their website in Google searches by employing the proper Search Engine Optimization (SEO) strategies.
From targeting the right keywords to optimizing your website’s on-page elements, by using SEO as a marketing channel, you can increase the quantity and quality of leads and applications coming from your website.
Organic search (SEO) has the second highest lead to application to student conversion rate, beaten only by Direct traffic, and it’s way ahead of other channels like Paid Search, Social, and others.
So, read on and learn more about how you can grow college enrollment with SEO for higher education, or directly take action and contact our agency that specializes in higher education SEO services.
The importance of SEO for college enrollments growth
There are currently 4,360 higher ed. institutions in the U.S., so this is undoubtedly a fiercely competitive market. Most are familiar with Google Ads and spend hundreds of thousands to millions of dollars on it yearly. The education vertical is one of the biggest spenders in Google Ads.
Yet, SEO which allows you to rank organically without the need to pay for every click, has a better ROI, and is more sustainable as a marketing strategy, is left out when the budgets are decided.
This could be your secret weapon.
The cost to show your ads for specific keywords has increased year over year, and the competition is brutal, but the same can’t be said about SEO. Over 70% of the clicks that happen on search results go to organic results, and only a few higher ed. institutions are capitalizing on it.
The goal is to rank for relevant keywords. This way, when students search these keywords, they will quickly come across your institution. The organic position of your site will help you expand your reach, resulting in more qualified traffic where students visiting your site are more likely to enroll in your programs.
Another benefit of using SEO as a marketing channel for your higher education institution is that it can help you improve the brand’s credibility. Typically, a higher search ranking is associated with credibility, as people are more likely to trust the first few results listed to provide the correct information.
In a chain reaction, the improved ranking that offers more credibility is then responsible for more qualified traffic, as reports show that the first organic result in Google Search has an average click-through rate of 43.32%. In addition, the second and third results have a 37.36% and 29.9% click-through rate, respectively. Therefore, SEO will not only help your site rank higher but, as a result, also make it a more trustworthy and reputable source, thus increasing student enrollment.
SEO strategies for college enrollment growth
Throughout the following sections, we will go into more detail about some SEO enrollment strategies where we tackle keywords, on-page SEO elements, mobile performance, website speed, and the content provided.
The role of keywords in SEO college enrollment
Keywords are a group of words people use in the search bar for information and are a fundamental part of SEO. By conducting keyword research, you can find out what terms people are actively searching for and how competitive each keyword is. You can then use the data gathered for marketing plans to increase your site’s organic traffic and ranking.
Before determining your content’s keywords, you must first identify your target audience via market research and your students’ insights. This way, you can pinpoint potential students’ needs, behaviors, and concerns and therefore consider what questions they might have regarding college and study programs so you can direct your keyword research toward the information they need.
Once you identify the keywords related to your services, you have also determined what the searchers want and, therefore, can focus your content on those topics to meet their wishes. The more instances of a keyword used in your content and meta tags, the higher the potential for better search ranking and improved visibility. But if you ignore keywords or use the wrong ones, you will not get the visitors you want because your content does not match what the audience is searching for.
Typically, keyword research tools identify the keyword’s monthly search volume and difficulty level. When choosing the keywords, you’ll want to find keywords that have a high monthly search volume but are also easy to use and have less competition.
The most important thing to remember when choosing keywords is understanding the search intent behind that keyword. When that is understood correctly, you know with what type of content (program page, info page, location page, or blog post) you can target that keyword & have a shot at ranking.
The importance of on-page optimization in SEO
On-page optimization refers to the SEO strategy that helps shape various structural elements of a website with the intention of increasing its search engine visibility and rankings. This strategy covers all internal aspects of a webpage, including the title tag, meta description, header tags, URLs, internal linking, and more, as they attempt to boost the page’s ranking.
Similar to what was previously discussed regarding keyword optimization, through on-page optimization, the implementation’s objective is to attract more qualified traffic through better visibility.
Your site can achieve such objectives through a series of actions. Firstly, update the title and description of pages/articles with relevant keywords and add necessary, creative, and engaging descriptions about the site and content integrated into it while maintaining a balanced ratio of targeted keywords used throughout them. Furthermore, it is best to structure the content using header tags that, once again, incorporate relevant keywords but also help present a better-organized page. Headers and subheaders offer the ideal areas to strategically include keywords without overstuffing the content.
Optimizing your site’s on-page content will help Google, and any other search engine gain context about the main topic and subtopics discussed on your page. This way, users can quickly determine that your site matches their search intent, click on it, and hopefully enroll at your college.
The importance of elevating your content strategy
Though keywords and on-site optimization help provide more visibility to your site and therefore help your site reach wider audiences, the actual test of whether you generate qualified conversions depends on the content provided once they click on your site. In short, elevating your content strategy is vital to college enrollment.
In your quest to improve your content, there are a few things you can do. To begin, go back to the target audience we mentioned. Think about your audience, what they want, and what they are searching for online. Then, consider how your programs can benefit them and create content compelling them to take action.
Your site will attract prospective students by providing helpful information, as the right content strategy is your ticket to establishing a positive brand image. Furthermore, having a precise content strategy that is value-based as well as audience-focused and being consistent with it will result in people constantly coming back for more content from you. As a result of all this, your audience will see your site as a trustworthy and informative source, and when the time comes to convert, they’ll remember and come to you.
The importance of optimizing your website for mobile & page speed
We’re seeing mobile become increasingly important to students’ research, particularly early in the process as students narrow their consideration sets. Higher education-related searches on mobile are on the rise, growing by 8% in 2017.2 And when an institution’s website or app wasn’t optimized for mobile, 36% of students said they’d be less likely to revisit it.
With more students choosing to research on mobile, it’s also crucial that marketers ensure that their websites and apps are optimized for a smooth, easy-to-navigate mobile experience and that attribution models are updated to accurately value mobile’s role in the path to enrollment.
Our experts point out that minimizing the use of plugins, leveraging caching, and image compression are some of the best practices that can help optimize your site’s page speed.
The benefits associated with page speed can be seen in one of our case studies. Before we started working with them, their site had several issues, including page speed. However, once we conducted our research, identified the problems, created the right strategies to deal with each one, and made the changes needed, the results were exceptional. Through similar approaches as the one provided above, we achieved a +550% increase in leads coming from SEO, a +2,500% increase in organic traffic, and an over $80k increase in monthly traffic value.
How to grow enrollment with SEO in higher education (Pacific College case study)
A sure proof of the success that can be achieved through SEO is our work together with Pacific College, which resulted in a 900% increase in organic leads.
The challenge:
Pacific College changed its CMS from WordPress to Squarespace in 2018. When this migration happened, many SEO best practices weren’t implemented, and the organic traffic dropped significantly.
They had a lot of deleted pages that used to drive tons of highly qualified organic traffic. These pages were deleted during the migration as the team managing this process wasn’t aware of their traffic contributions to the site.
Also, when the CMS changed, the URL structure changed as well. Program pages were the ones most affected by this. Important pages with a lot of backlinks weren’t migrated to the new Squarespace site, resulting in ‘link equity’ going to 404 pages instead.
They lacked content. A news section existed, and it was updated from time to time, but apart from that, there was no content strategy in place.
Conversion tracking wasn’t set up. Google Analytics was implemented, but it wasn’t tracking any type of conversions. Also, when the new Squarespace website was built, a new GA view with no historical data was created & implemented, resulting in fragmented data sources.
What did we do?
Missing pages: We recreated and updated all the missing pages deleted during the migration. We did the same thing with broken pages that had backlinks. In just a few weeks, they started to drive a significant amount of qualified search traffic back to the site.
Broken internal links: We fixed all broken internal links. We used this opportunity to audit all internal links, optimize anchor text on most of them, add new internal links on pages where we had this opportunity, and other optimizations.
Website speed: We identified the areas slowing down the site and optimized those for better performance.
Conversion tracking: We implemented best practices, and the data we were able to gather from tracking conversions helped us adjust and improve our overall SEO strategy.
Content strategy + implementation: After we were done with the SEO audit, we dived deeper into understanding / analyzing the search landscape & our competitors. We found out that there is a lot of search demand around the degrees Pacific College offers, and very few institutions are talking about them.
We realized that there is a lot of potential in creating content around informational topics like “lvn vs rn” or “what does a nurse practitioner do”. These were potential students looking to educate themselves, and the pages that were ranking weren’t doing a great job of offering the best answer.
We had the expertise & it was in our niche, so we did an extensive keyword search, built a content calendar, and started publishing content regularly.
Conclusion
While students’ paths to enrollment have migrated almost entirely online, they still crave the knowledge gained by a real-life campus visit—and SEO is making it easier for schools to bridge that gap. As higher education options become more readily available, institutions can capture prospective students’ attention by showing up in search results with helpful, relevant content and creating a seamless experience for them as they bounce between devices to help inform one of the most important decisions of their lives.
Are you interested in witnessing firsthand all the benefits of a good SEO strategy? Contact us for a free SEO gap analysis to learn more about the potential of your site and all the opportunities we can provide you with. Begin your SEO journey and take the first step toward success!
Lead Generation Strategies for Higher Education
High demand for enrollment is a clear reflection of a school’s success. That’s why the primary function of any higher ed. institution’s marketing department is to target potential leads and convert them into students.
In your quest to attract more leads which you will then try to turn into enrollments, you must develop effective strategies that will help you succeed.
Read on and dive deeper into the world of lead generation for higher education. From utilizing unique ads in various social media platforms to using chatbots, learn what tools have the most significant value in lead generation for higher education.
Which Strategies Are Most Effective for Generating Leads in Higher Education?
To help you make the most out of lead generation and compete, we have compiled a list of the most effective strategies you can use.
Strategy 1: Develop a strong SEO and content marketing strategy
Using search engine optimization (SEO) and content marketing is the best strategy that can help your institution generate leads.
There are three key areas you need to focus on when trying to increase your leads through SEO:
Technical SEO (are there any technical issues on the website preventing Google from finding all the pages and indexing them)
Content (do we have the content our target audience is searching for, and are we using the right keywords to target/optimize it?)
Authority (does our website have enough authority to be able to rank and compete for top keywords?)
The first step is to start with a Technical SEO audit. This audit will highlight any technical SEO issues that could be preventing your website from achieving its full potential in search results. We’ve done hundreds of audits for university/college websites, and here’s what we usually find:
thousands of pdf files indexed by Google (this is an issue because every page on your site is a data point to Google and their understanding of your site – when you have your meeting minutes or student homework indexed in the search results, you are confusing Google on what your site is about)
crawl depth is 5+ clicks (crawl depth tells us how many clicks a user or Google needs to do from the homepage, to go to a certain page. If this is more than 3-4 clicks, we signal Google that this page is not that important for us. In our audits, the most important pages are usually 6-7 clicks away from the homepage, and this hurts their performance and rankings in the search results)
JavaScript is not rendered by Google (this means we have important content behind JavaScript and Google is not seeing it, this is a major issue because if Google can’t see that content, our page will not be evaluated the right way and will underperform in the search results)
and dozens of other issues…
Once the issues are identified, you want to work together with the IT department to make a plan on addressing/fixing these issues. Not all issues are equal, so prioritizing them based on the SEO impact they will have is very important.
Next, we want to address the content on our website. This includes the content on our program pages, our info pages, and the blog (if we have one).
Program pages are the most important pages on our website. We want to make sure they have the content a student expects to see when they land on a program page.
Content depth is very important (how much content we have on our program pages), as seen by the example below. WGU has 3,736 words of content on their accounting degree program page, and they’re ranking in the 2nd position for the [accounting degree] keyword. ASU is doing well, too, with over 2,400 words of content, while UND is underperforming, their page has only 735 words.
The last part is Authority. For most institutions, this won’t be an issue since by default, the websites are quite authoritative. The authority of a website in SEO is measured by the number of links from external websites pointing back to our own website. The more links we have from relevant websites, the more authoritative our website becomes.
That doesn’t mean we should invest in link building, to increase the website authority. Our recommendation is to focus our link building efforts on the program pages. This will increase the chances for the program pages to rank for their target keywords.
There’s much more to SEO than what we just described above. But if you just do the above, you’re already ahead of most of your competition.
SEO is the best performing channel after direct traffic, when it comes to lead quality and conversion rate from lead to application to enrollments. Your target audience is engaging with Google, asking questions, and researching information from the very first day they decide they want to go to college. Making sure you’re visible when they search for your programs will have a significant impact on your lead generation efforts.
Manaferra is an SEO agency specializing in Higher Education. We only work with Higher Ed. Institutions offering SEO services. We’ve won the Best Use of SEO for Higher Education award for our work with Pacific College (US Search Awards) and the University of the Potomac (Global Search Awards).
If you have a program that is underperforming and are interested to see if SEO can change that, contact us today. Our SEO Specialists will create a free customized report highlighting the existing performance of that program, the growth potential, and the strategy to get there.
Strategy 2: Use lead generation ads across social media platforms
Digital marketing, especially through various social media platforms, has increased significantly in recent years. Your university or college can benefit substantially from using social media ads, as surveys show that one in two Gen Zers and Millennials think such platforms are the most relevant channels for presenting advertisements. Therefore, they are more likely to interact with the ads and help you improve your site’s lead generation.
Lead generation ads are a particular type of digital ad that enable you to collect data about potential customers while simultaneously promoting the school’s study programs, courses, and any events the institute is hosting.
All the major social media platforms offer these ads, including Facebook, LinkedIn, Instagram, YouTube, Twitter, and more. Utilizing these lead ads can improve your site’s conversion rates by allowing students to directly submit their information to you through the ad instead of being redirected to another page. This is just one example of what barriers to conversion you can lower to make your site more user-friendly and decrease exit rates.
Lead ads ensure a hassle-free and time-saving experience for the audience, as well as provide you with basic information that you can use to build up a customer database of potential leads for future correspondence. With a customer database, it will be easier to target a specific portion of your audience and further improve your ads with tailored questions and content that help uncover the preferences of potential students and ensure that you are reaching out to them with the correct information.
In addition, our experts point out that you can effectively use segmentation in Google Analytics 4 for higher education by dividing visitors who have visited your site regarding a specific study program but did not request further information. Then, with the engines’ tools, you can use custom dimensions to understand their behavior compared to the converted leads and notice areas you can improve.
Strategy 3: Use virtual events for lead generation
Virtual events are a popular way for institutes to promote their products and services, especially since the COVID-19 pandemic when virtual events became the only feasible alternative to physical gatherings due to government restrictions and lockdowns. Even now, when restrictions have been lifted, there is high demand for virtual events, with the global virtual events market size expected to grow by 21.4% over the next decade.
There are various virtual events to choose from, including virtual open houses, webinars, and live streams, allowing attendees to learn more about your higher education institution, its academic programs, admissions, financial aid, campus life, and more. These events are an excellent tool for lead generation because you can safely assume that the people attending them are interested in the topics discussed and, therefore, in becoming actual students of your institution or partaking in other services.
Utilizing such events is a great way to interact directly with your leads and show them that your college or university would be a good match for them. So, make sure to plan and host the event accordingly, selecting a suitable platform and promoting the event on various social media sites in order to reach your target audience and beyond.
One of the most significant benefits of virtual events is that such events are not constricted to space; therefore, you can generate leads from thousands of miles away without needing any of the two parties to travel. Likewise, you are not restricted to a certain number of people, as would be the case with an in-person gathering. You can have a much larger audience, thus increasing the probability of generating relevant leads that may be converted to actual students without any additional costs.
However, you might encounter challenges as you plan virtual events, specifically keeping your attendees engaged. To overcome such a challenge, you must carefully plan and manage the event to create an immersive experience for each attendee by including various polls, surveys, live Q&As, etc. Such activities will help you gather data about the audience you can use to send invites and keep them updated about upcoming events, thus, generating more precise leads that become enrolled students.
Strategy 4: Implement advanced chatbots
Keeping up with the fast and continuously evolving world of digital communication requires adaptability to new trends. In the context of higher education institutions, this means putting the students first and utilizing all tools that can help them easily navigate through your page and find relevant information about the school.
For example, the global chatbot market is valued at $3.78 billion and is projected to increase by 30.29% until 2027. Therefore, a valuable strategy regarding lead generation for higher education would be implementing advanced chatbots that can help you connect with your audience in online environments. These chatbots help ease your workload—they are programmed to help all website visitors be redirected to the area they are interested in and obtain answers to their questions. Thus, they aid in reducing frustration, providing personalized communication, and improving user experience.
Depending on the exact strategy you want to follow, you can implement various chatbots, such as lead qualification chatbots, booking chatbots, and conversational chatbots. When implementing them for your higher education institution, it is essential to identify the correct use case. Some areas of chatbot use cases that can have a significant impact on lead generation include:
Chatbots in customer service
Chatbots for social media
Conversational AI for messaging apps
Chatbots for human resources
Chatbots for sales
Chatbots for marketing
Chatbots for personal services
Voice-based chatbots
For any chatbot you decide to implement, you must carefully consider the conversation flow and ensure that it best represents your brand and provides all the necessary information about your study programs or courses to build rich engagement with your audience. This way, you can avoid one of the most common challenges that developers face when creating and implementing chatbots—the chatbot’s ability to interpret messages and understand the user’s intention.
Chatbots provide their services 24/7; therefore, your site will be up and running with a unique computer program designed to simulate human conversation, help visitors, and work toward generating leads during and outside of office hours.
Strategy 5: Develop an effective PR strategy to generate leads
Establishing a successful public relations strategy is essential as it helps build your brand’s reputation, thus influencing your lead generation. By creating a positive and trusting image around your higher education institution, combined with all the other strategies listed throughout this blog, you attract leads that have the potential to turn into enrollments.
The primary challenge PR strategists face in the context of higher education institutions is choosing the right message and using their branding to turn qualified leads into students. That is why defining your target audience and presenting a relevant message about your brand when developing your PR strategy is crucial. This way, you ensure that your content is perfectly shaped around your audience and their needs.
Additionally, you must carefully consider the channels and mediums you utilize to reach out and the type of content you post to present the best version of your brand to the public. Such an approach helps you establish a positive brand image as well as generate leads and conversions.
PR strategies should be developed with a long-term goal in mind and managed carefully. You should always be working on nurturing and maintaining a positive reputation in order to allow visitors to take their time in getting to know your branding, understanding your goals and the opportunities you can provide, and finally—trusting your institution.
FAQ
1. What is lead generation, and how does it apply to higher education?
Lead generation refers to the process of initiating a customer’s interest in your product or service. In higher education, lead generation represents identifying and attracting prospective students to your college or university.
2. Why is lead generation important for higher education institutions?
Lead generation ensures that your higher education institution continues to grow and reach more potential enrollments, which in turn helps with revenue generation.
3. What are some common lead-generation strategies and tactics used in higher education?
SEO
Content Marketing
Lead Ads
Private Relations
Chatbots
Virtual Events
4. How can technology and digital marketing be used to support lead generation in higher education?
They can be used to run advertising campaigns that reach the target audience and set up landing pages that help convert website traffic into qualified leads.
5. What are the potential benefits and risks of lead generation for higher education institutions?
The benefits of lead generation include a higher rate of college enrollment, improved visibility, and increased revenue, among other benefits. The risks associated with lead generation are a lack of relevant data and practical strategies, typically caused by one’s lack of understanding of the lead generation process.
6. How can higher education institutions measure the success and ROI of their lead-generation efforts?
To measure the success and return on investment (ROI) of your lead generation efforts, take the monetary growth from your institution, subtract the marketing costs, and divide by the marketing cost. Generally, an annual ROI of over 7% is considered a success.
7. What are some of the best practices for implementing lead-generation campaigns in higher education?
Before implementing lead generation campaigns, ensure you identify your target audience and have a clear long-term goal about what you want to achieve. Gather and analyze data about your audience and, through segmentation and targeting, determine potential students and customize your campaigns to their requirements and needs.
8. How can higher education institutions ensure that their lead generation efforts are compliant with regulations and laws, such as the General Data Protection Regulation (GDPR) or the Telephone Consumer Protection Act (TCPA)?
To ensure that your efforts are compliant with regulations and laws, you must ensure that:
Your data is adequately secured
You have updated your privacy disclaimers
You conduct an official examination of how your information is stored
Customize your site’s privacy policy rules to comply with the regulations and laws
Have a designated team member in charge of monitoring the lead generation campaigns in terms of compliance
9. How can higher education institutions optimize their lead generation efforts for different stages of the customer journey, such as awareness, consideration, and decision?
They can optimize their lead generation efforts through advertising campaigns encouraging prospective students to engage with their institution. Then, they can use PR campaigns and SEO strategies to boost the consideration stage and push them toward conversion in the decision-making stage with virtual events, content marketing, chatbots, and other tools.
10. How can higher education institutions stay up to date with the latest lead generation trends and best practices in the sector?
Staying up to date is a continuous process; therefore, they should constantly read relevant blog posts and newsletters, attend events in this sector, embrace social media, etc. Alternatively, they can employ capable agencies that are one step ahead in the lead generation game.
Conclusion
There are millions of people out there who are looking for all that your institution has to offer. All that is left to do is ensure that you do your best to provide them with opportunities for interaction with your site. If you still need help with generating leads, contact us, get a free SEO gap analysis from our experts, and discover the full potential of your site. Seize this opportunity and take your institution to the next level!
6 Higher Education Digital Marketing Strategies, Trends & Tactics for 2023
Over the last few years, technology and the internet have become even more prevalent in higher education, thus highlighting the importance of effective digital marketing strategies for these institutions. By building a strong online presence, higher education institutions will be able to reach and engage with their target audience.
By having an active digital presence, your school will be able to:
provide 24/7 information access to audiences,
tell their story virtually, and
use data to make informed decisions.
The focus this year will be on the existing digital marketing strategies and finding ways to best optimize your content in the ever-changing industry.
In this article, we’ll dive deep into the digital marketing strategies, trends, and tactics to look out for in 2023.
1. Transition to Google Analytics 4
One of the key pieces of making informed decisions about your marketing strategy is collecting and analyzing data. When utilizing Google Analytics 4 (GA4), you’ll be able to track the traffic and performance of your website, thus developing effective digital marketing strategies to increase enrollment.
Google will transition from Universal Analytics to Google Analytics 4 on July 1, 2023. It would be best to plan the transition and get acquainted with the new changes before then. Some of the most significant changes on the platform are:
Data collection: with an entirely different data model, any interaction in any device is organized under Events, which belongs to a User. This way, GA4 can link all interactions and enables you to organize them as need come,
AI + Machine learning: through Machine learning, Google is able to fill data gaps and make forecasts that predict future behavior. By using conversion rate data from past activities, you’ll be able to make predictions on enrollment numbers and potential students.
Cross-device tracking: with this feature at the heart of GA4, the new data model allows it to store data from multiple sources and send them for further analysis. The cross-device tracking mechanism is based on “Identity spaces”, which identify a user using multiple data points. This is done through three types of identifiers: User ID, Google Signals, and Device ID.
2. Reevaluate Your Higher Education Social Media Marketing Strategy
With 2022 being a challenging year for social media platforms, 2023 becomes the year to reevaluate what’s working and what’s not and how to relocate sources in SEO.
Let’s take a look at the four areas of high ed. digital marketing you can reevaluate and focus on in 2023.
Increasing brand awareness: You can use brand strategy to show what makes your institution unique and stand out.
Boosting social media presence: Considering 54% of Gen Zers use social media for more than four hours a day, boosting your social media presence will increase engagement.
Promoting purpose-driven campaigns: As an academic institute, you want to be inclusive and encourage diversity in all its forms; promoting purpose-driven campaigns can be an initiative towards showing leadership in this area.
Involving current students and alumni: By sharing stories or interviews of students or alumni, you can reach and influence more people.
3. Explore AI-Generated Content
Last year we saw a lot of progress with AI content generators, progress estimated only to grow. And while the content is still stilted, it can be a helpful tool in higher ed. digital marketing.
Some of the ways you can use AI in higher education digital marketing are:
Content optimization: AI tools can help analyze your website’s content and suggest ways to optimize it for search engines. In this area, Frase or MarketMuse can help you out.
Chatbots: with ChatGPT taking off by the storm, it can be a valuable tool for creating content, providing 24/7 service, answering frequently asked questions, and making content recommendations.
Email marketing: AI can also be useful in optimizing email marketing, thus resulting in higher open and click-through rates. For this purpose, you can use tools like Persado or Phrasee.
Ad targeting: AI can help target specific demographics and reach a wider audience. An AI tool you can use is Google’s Smart Bidding; after analyzing your previous campaigns, it will automatically find the optimal bid to drive higher conversion volume.
Predictive analytics: You can also use AI tools (Lattice and C3 IoT) to address potential issues and find new opportunities.
4. Incorporate Short-Form Video Into Your Higher Ed. Marketing Strategy
According to Video Marketing Statistics, video use in marketing in 2022 was 86%, and with Gen Zers preferring social media platforms with short video features (60% of them use TikTok), video use in marketing is projected to grow. Therefore, incorporating short videos into your school’s digital marketing strategies will help you be ahead of the game.
You can include short videos (preferably under 90 seconds) on your homepage or other high-converting pages; you can try the following:
Campus and facilities tours
Student takeover
Sports and event highlights
Student interviews
Insight from professors and academic leaders
Because many students won’t be able to take in-person tours, they can take virtual tours; they’ll be able to get familiar with the campus and staff, thus increasing enrollment chances.
By using sharable short videos, you’ll be able to drive organic traffic and make your site more homely, interactive, visually appealing, and convincing.
5. Include Responsive Ads in Your Higher Education Advertising Strategy
Another higher ed. digital marketing strategy to look out for is the use of responsive ads. As flexible adverts that can adjust their shape, appearance, and size to fit in a website or app, they are highly visible and don’t disturb the user experience. According to Google, when using multiple headlines, descriptions, and images with responsive ads, advertisers see 10% more conversions with a similar CPA.
Optimizing your ads: When uploading different assets into Google Ads, thus creating a responsive ad, Google’s machine learning model will determine the optimal combination of assets based on your performance history.
Reaching broader: because of the flexibility in shape, size, format, and appearance, you’ll be able to upload multiple assets per asset type.
Using videos: To maximize your reach on the Display Network, you can also add videos to your responsive ads.
Using with feeds: Because responsive ads show personalized content from a feed you add and control, you’ll find your ads in dynamic and static formats by adding a feed to your campaign.
Saving time: By using responsive ads, you’ll be able to focus more on performance improvement rather than managing ad portfolios within campaigns.
6. Increase Search Engine Visibility via SEO
As the primary goal of digital marketing for your school’s website is to attract more students, you have to ensure that your school is easily found online. By adopting SEO practices and thorough keyword research, you’ll be able to improve your rank and appear higher on search engines.
Some of the ways you can make your website more visible on Google are:
Creating quality content
Making it sharable
Getting verified by Google
Creating more pages
Targeting your pages for keywords
Using Google Ads
Using compelling page titles
Composing better meta tags
Building a backlink strategy
Another way to increase site visibility is to win a Google’s snippet box. This box describes a page before linking that page; this is a way of helping people find the information they need more easily. Google chooses these snippets based on whether a page can fulfill a specific search request. Through the snippet box, you’ll be able to drive more organic traffic and prove your authority in the subject matter.
Conclusion
By understanding and adopting the trends of digital marketing strategies for higher ed., you’ll be able to increase enrollment figures and conversion rates. Your school will also be able to connect better with the target audience and give insight into what makes you stand out.
The points above indicate that the latest trends focus on identifying prospective students, admission inquiries, conversion rates, and click-through rates. The process of identifying prospective customers is called lead generation, which can also be applied to higher ed. You can learn more about lead generation strategies here.
So, what’s next? If you want to stay up-to-date with current trends and increase your student base, you can book a free consultation and learn more about what digital strategies you can adopt for optimal results. You can also check out case studies on how an SEO agency for higher education. can make a difference.
Data Visualization for Content Marketing 101: A Comprehensive Guide
Data visualization is the representation of information and data in a graphical or pictorial format. It enables businesses to communicate complex ideas and data sets effectively, making it easier to understand, retain, and communicate information to a wider audience.
In today’s world, where people are inundated with information from multiple sources, data visualization has become an essential tool for content marketers to engage their audience and make a lasting impression.
But which is its role in Content Marketing and why is it essential you use them in your content pieces? Let’s roll.
Why do we use data visualization?
Before we go on and explain the what & how, it’s first essential we get the why. Imagine traffic lights. You’re driving in your car, come near an intersection, and see the following sign.
On average, it takes people 12 seconds to read the above statement. Imagine the chaos and risk that would cause in that time. Now, take a look at the next sign.
The average driver reaction time is 0.75 seconds. Now, you know this sign means stop, without having to analyze it for eternity. This, in a nutshell, is exactly why we use data visualization in content marketing. Our brain constantly accumulates information from the environment and filters what is important. Through data visualization, we aim to immediately convey the main information to the reader as fast and concise as possible. Here’s how it works.
Improved Understanding
Data visualization makes it easier for people to understand complex data sets and ideas. It helps to clarify the relationships between data points, and to highlight patterns and trends that may not be immediately apparent from raw data.
Increased Engagement
Data visualization can help to engage your audience, making them more likely to pay attention to your message and to remember it. With interactive and visually appealing visualizations, you can grab the attention of your audience and keep them engaged.
Better Decision-Making
Data visualization can help decision-makers to make informed decisions by presenting data in a way that is easy to understand and interpret. It can help to identify key trends, patterns, and insights that are relevant to decision-making, and to present this information in a clear and concise way.
Better Communication
Data visualization can help to improve communication by making it easier to share complex data sets and ideas with others. Whether you’re communicating with stakeholders, customers, or team members, data visualization can help to simplify and clarify your message.
The role of Data Visualization in Content Marketing
Data visualization is a valuable tool for content marketers who are looking to improve their search engine rankings and attract more links to their content. Here are some ways that data visualization can help.
Increased Shareability
Data visualizations are often more visually appealing and memorable than plain text or tables. This makes them more likely to be shared on social media, increasing the visibility and reach of your content. The more shares your content gets, the more likely it is to be seen by a wider audience and to attract new links.
Better User Experience
Data visualizations can help to make your content more engaging and interactive, improving the overall user experience. This is important for search engines like Google, which prioritize user experience when ranking content. By using data visualization, you can make your content more engaging, keep your audience on your page for longer, and improve your search engine rankings.
Improved Linkability
Data visualizations can help to create a more linkable asset. For example, if you create a unique and compelling visualization that is useful and relevant to your audience, others may want to link to it from their own websites. This can help to build your authority and improve your search engine rankings over time.
Increased credibility
Data visualizations can also make your content look more trustworthy and authoritative. By presenting data in a clear and visually appealing way, you demonstrate that you have a good understanding of the topic and that you have taken the time to research and analyze the data. This can help to establish your credibility and make your content more appealing to other websites that are looking to link to authoritative sources.
By using data visualization, you can differentiate your content from plain text articles and make it more attractive to other websites that are looking to link to credible and informative content. This can increase the chances of your content getting picked up and linked to by others, boosting your search engine rankings and visibility.
Data visualization vs. Data storytelling
Data visualization and data storytelling are two very similar terms; still, they do have some notable differences.
Data Visualization refers to the process of creating visual representations of data to help make sense of the information. This can involve using graphs, charts, maps, or other types of visual elements to present data in a clear and concise manner. The main goal of data visualization is to help the audience understand and analyze the data.
Data Storytelling, on the other hand, goes beyond just presenting data. It involves taking data and turning it into a narrative that is engaging, memorable, and easy to understand. Data storytelling uses data visualization, but also incorporates other elements such as images, text, and multimedia to create a complete story. The main goal of data storytelling is to communicate the story behind the data in a way that is impactful and memorable.
In content marketing, you need both to make your case.
Best Practices for Data Visualization in Content Marketing
Data visualization can be a powerful tool for content marketing, but it’s important to use it effectively. Here are some best practices to follow:
Rule of thumb
If there’s something we want you to remember from this article, it’s this: Can a naive user understand what the visualization is trying to convey based only on the visualization itself? We can’t stress this enough. If you’re not able to convey the information immediately to the user and make them read additional information to understand it, you’ve lost them.
Choose the Right Type of Visualization
This is one of the most important practices. Choose the right type of visualization to suit the data you have and the story you want to tell. For example, if you want to compare data across categories, use a bar chart. If you want to track changes over time, use a line graph.
Use a Storytelling Approach
Use data visualization to tell a story. Use it to highlight important trends, patterns, or insights, and to make complex data sets easier to understand.
Keep it Simple
Avoid overcomplicating your data visualization. Keep it simple and easy to understand. Use clear labels, and choose colors that are easy on the eye.
Color is a powerful tool for grabbing attention and conveying information. Choose colors that are easy to distinguish, and use color to highlight important data points or trends. Always remember to use colors that match the brand.
Let’s take as an example the Top 10 languages WordPress is most used in. Considering the dataset, this is best represented through a bar chart.
This is a bad example on how to visualize a bar chart. There are many colors, and the user doesn’t know where to focus. Let’s fix it.
Here, we can immediately notice that English is way more popular than other languages, and that’s the information we want to convey. That’s why we used a different color to highlight it. The other languages, however, do not have different colors. Instead, they’re represented with the same one.
Another common mistake many people make when visualizing data is using wrong colors in maps.
The above map visualizes the top states for plastics employment, and uses different colors to highlight different states. This, more often than not, will confuse the user. There are many colors used, sometimes red means lower than green, and the reader just doesn’t know where to focus. Let’s fix this.
Notice how the colors are ranked from colder to hotter. The darker the green, the higher the employment number.
Label Data Properly
Label your data visualization clearly and accurately. Use clear, concise labels that explain what each data point represents. You don’t want to have a dataset that tells one thing and a data visualization that tells another.
As previously mentioned, choosing the right data visualization is critical for conveying the correct information to your audience. But with tens of different visualization types, how do you choose the right one? Trust us, it’s not rocket science. The trick is to answer these four main questions.
What message do you want to convey with the data?
What is the main purpose of your data visualization?
Who is the audience?
What’s the type of dataset you’re working with?
Let’s go through each one of them.
What message do you want to convey with the data?
Do you want to show a simple statistic of which country had the highest air pollution level last year? Or do you want to convey a more complex message that shows correlation between different variables and might want to motivate your audience to take action?
Let’s take the first example. We want to show which countries had the highest deaths due to air pollution in the world and rank them from highest to lowest. This dataset was randomly chosen from Kaggle.
This dataset is shown as a table. In one column, we have a categorical variable (Country) and in the other a quantitative variable (Deaths). The categories are sorted by number of deaths rather than alphabetically by genre. This makes it easy to glance at the table and get an idea of which countries had the highest number of deaths.
Adding to this, the table takes up relatively little space. If the purpose of the data visualization is to communicate simple information about the number of air pollution deaths in specific countries, this table is a good choice. But what if the information is more complex?
Next, we have a table created with the same dataset but showing slightly different information. Instead of total air pollution deaths, this table presents the deaths for two different scenarios: indoor air pollution deaths and outdoor air pollution deaths.
Comparing air pollution deaths between several countries was very straightforward. However, comparing different forms of air pollution deaths between said countries is a bit more complicated. As a result, our message isn’t communicated effectively.
By changing the type of data visualization here, we can effectively communicate more information. The following displays the same data and the table previously used, but in the form of a grouped column chart.
Now, it’s evident that the majority of air pollution deaths are caused by indoor air pollution rather than outdoor particulate matter.
What is the main purpose of your data visualization?
When it comes to their purpose, data visualization can serve for various purposes. We can sum the up in four:
Comparison
Example: Comparing the sales of two different drinks in the same restaurant
Composition
Example: Showing the breakdown of a kindergartener’s favorite fairy tales
Distribution
Example: The number of Covid-19 deaths in each state
Relationship
Example: Showing how higher salaries are correlated to better employee performance
Types of Data Visualization
There are several types of data visualization techniques, each with its own strengths and weaknesses. When choosing a data visualization method, consider the type of data you have, the story you want to tell, and the audience you are trying to reach.
When it comes to their purpose, data visualization can serve for various purposes. We can sum the up in four:
Comparison
Example: Comparing the sales of two different drinks in the same restaurant
Composition
Example: Showing the breakdown of a kindergartener’s favorite fairy tales
Distribution
Example: The number of Covid-19 deaths in each state
Relationship
Example: Showing how higher salaries are correlated to better employee performance
Comparison
Bar Chart
The bar chart is best used when comparing individual data points. When you only have 2 data
points, then you may use 2 different colors for each bar. However, when several data points are to be shown, then it is best to use a single color for all bars, and only highlight one (when needed with a different color).
So in general:
Accent colors are ideal if you want to highlight a significant data point.
Bars should be wider than the white space between bars.
Write labels horizontally (not vertically) for better readability.
When possible, order items by value to ensure consistency and readability.
Column Chart
Column charts are used to compare values across different categories or groups. The height of the columns represents the size of each category, making it easy to identify which category is the largest or smallest. Column charts are particularly useful for displaying data that changes over time or for comparing data across different categories.
Some tips for creating effective column charts include:
Use contrasting colors to highlight important data points or trends.
Use consistent widths for columns to maintain the visual integrity of the chart.
Label the y-axis clearly to ensure accurate interpretation of the chart.
Use descriptive labels for the x-axis to make the chart easy to read.
Avoid clutter by limiting the number of data categories or groups.
Circular Area Chart
Circular area charts, also known as polar area charts or rose charts, are used to display data in a circular format. They are particularly useful for displaying data that has a cyclical or radial pattern, such as wind direction or radiation intensity. Circular area charts are similar to pie charts, but instead of using slices, they use sectors of different sizes to represent the data.
Here are some best practices for creating effective circular area charts:
Use contrasting colors to highlight important data points or trends.
Order the data in a logical sequence, such as clockwise from the top or in decreasing size.
Use a legend to explain the data categories or groups.
Ensure that the chart has a clear title and that the axes are labeled accurately.
Avoid clutter by limiting the number of data categories or groups.
Table
Tables are an effective way to present data in a structured format, making it easy to compare different data points. Tables are particularly useful for displaying large amounts of data that can be sorted and filtered, such as financial data or demographic information.
Here are some best practices for creating effective tables:
Use contrasting colors or shading to highlight important data points or trends.
Ensure that the table has a clear title and that the columns and rows are labeled accurately.
Avoid clutter by limiting the number of data categories or groups.
Use appropriate formatting for the data, such as numerical values or percentages.
Consider using filters or pivot tables to make the data more interactive and easier to analyze.
Line Chart
Line charts, by contrast, are primarily used to only show one data-set over time. So when you are trying to show how something has changed over time (an increase or decrease of sorts), this type of graph usually does the trick. Now, you may still use this when comparing several data sources, but usually, anything more than 3-5 lines will be overwhelming.
A couple of points here:
Use solid lines only because dotted or dashed lines are distracting.
Ensure that points are ordered consistently
Label lines directly and avoid using legends.
Don’t chart more than four lines to avoid visual distractions.
Zero baseline is not required, but it is recommended.
Relationship
Scatter Chart
Scatter charts, also known as scatter plots, are used to display the relationship between two variables. They are particularly useful for identifying trends or patterns in data that may not be immediately apparent. Scatter charts use a series of points that are plotted along the x and y axes, with each point representing a unique data point.
Here are some best practices for creating effective scatter charts:
Use contrasting colors or shapes to highlight important data points or trends.
Label the x and y axes clearly to ensure accurate interpretation of the chart.
Use descriptive labels for the data points to make the chart easy to read.
Consider using regression lines or trend lines to highlight trends in the data.
Avoid clutter by limiting the number of data categories or groups.
Bubble Chart
Bubble charts are a variation of the scatter chart that adds a third dimension to the data. The size of each bubble represents the value of a third variable, in addition to the x and y variables. Bubble charts are particularly useful for displaying data that has multiple dimensions or for comparing data across different categories.
Here are some best practices for creating effective bubble charts:
Use contrasting colors or shading to highlight important data points or trends.
Label the x and y axes clearly to ensure accurate interpretation of the chart.
Use descriptive labels for the data points to make the chart easy to read.
Ensure that the size of the bubbles is proportional to the value of the third variable.
Avoid clutter by limiting the number of data categories or groups.
Composition
Pie Chart
This one is super common, and I’d expect you’ll need to use one of these very often in your work. Pie charts are used when comparing percentages of the same source. The cool thing about them is that they can easily be stylized: whether in 2d colors, or fully 3d and interactive.
Points to follow:
Limit categories to up to 7 to ensure differentiation with the slices.
Double-check if the total value of the slices is equal to 100 percent.
Group similar slices together in one bigger slice to reduce clutter (rename
accordingly).
Make your most important slice stand out with color. Use shades of that specific color to highlight the rest of the slices.
Order slices thoughtfully. For example, you can place the largest section at the 12 o’clock position and go clockwise from there. Or place the second largest section at the 12 o’clock position and go counterclockwise from there.
Waterfall Chart
Waterfall charts are commonly used to illustrate how an initial value is affected by a series of positive or negative values. It is particularly useful when trying to show the contribution of different factors to a total value.
Some tips to follow:
Color code the rising and falling segments differently for better contrast and ease of understanding.
Label each section of the chart to provide a clear explanation of the change it represents.
Use a baseline that starts at zero for better accuracy and easy comparison.
Ensure that the chart is easy to read by avoiding too much detail or too many segments.
Stacked Area Chart
Stacked area charts are used to show how different categories contribute to the total value of a dataset over time. They are useful when trying to show trends and patterns in data over a specific period.
Some key points to remember:
Ensure that the chart is easy to read by using a limited number of categories.
Color code each category for better contrast and ease of understanding.
Ensure that the chart is easy to understand by adding clear labels and a legend.
Ensure that the chart is easy to interpret by using consistent scales on the x and y-axes.
Stacked Column Chart
Stacked column charts are similar to stacked area charts but instead of using an area to represent the data, they use columns. They are useful when trying to show how different categories contribute to a total value.
Some tips to follow:
Ensure that the chart is easy to read by using a limited number of categories.
Color code each category for better contrast and ease of understanding.
Ensure that the chart is easy to understand by adding clear labels and a legend.
Ensure that the chart is easy to interpret by using consistent scales on the x and y-axes.
Distribution
Column Histogram
Column histograms are used to show the distribution of a continuous variable. They are particularly useful when trying to identify the most common values in a dataset.
Some key points to remember:
Choose an appropriate number of bins to ensure that the chart is easy to read and interpret.
Ensure that the chart is easy to understand by adding clear labels and a legend.
Use consistent scales on the x and y-axes to make the chart easy to interpret.
Color code the columns for better contrast and ease of understanding.
Line Histogram
Line histograms are similar to column histograms but instead of using columns, they use lines to connect the frequency of each value. They are useful when trying to show the distribution of a continuous variable.
Some tips to follow:
Choose an appropriate number of bins to ensure that the chart is easy to read and interpret.
Ensure that the chart is easy to understand by adding clear labels and a legend.
Use consistent scales on the x and y-axes to make the chart easy to interpret.
Color code the lines for better contrast and ease of understanding.
3D Area Chart
3D area charts are used to show how different categories contribute to the total value of a dataset over time, with the added dimension of depth. They are useful when trying to show trends and patterns in data over a specific period.
Some tips to follow:
Ensure that the chart is easy to read by using a limited number of categories.
Color code each category for better contrast and ease of understanding.
Ensure that the chart is easy to understand by adding clear labels and a legend.
Ensure that the chart is easy to interpret
Map
Maps are a powerful tool for visualizing data on a geographical scale. They can help to show the distribution of data across a region, and can highlight patterns and trends in data that are specific to a particular location.
Always keep in mind to:
Choose the right map type. Choose the right map type for your data and story. Different types of data may require different map types.
Simplify the map. Simplify the map as much as possible to make it more accessible and understandable.
Use color effectively. Choose colors that are easy to distinguish and that make sense in the context of your data.
Show context. When possible, provide context for the map by including relevant information such as location names, political boundaries, and other relevant landmarks.
Make it interactive. Consider making your map interactive, allowing your audience to zoom in, pan around, and explore the data in more detail.
Consider mobile. Make sure your maps are responsive and display well on different screen sizes and devices.
Content marketing data visualization tools
There are several tools available for data visualization, ranging from simple online tools to complex data analysis platforms. Here are some of the most popular and easy-to-use tools for data visualization:
Flourish
Flourish is a web-based platform for creating interactive data visualizations and storytelling. It provides a user-friendly interface and a variety of templates and customization options for creating engaging and informative graphics. With Flourish, users can import data from a variety of sources and transform it into visually appealing and interactive visualizations, including charts, maps, and animations. Datawrapper
Datawrapper
Similar to Flourish, Datawrapper is a data visualization tool designed for creating clear and effective data-driven graphics for content marketing. It is a cloud-based platform that allows users to upload data and choose from a range of customizable chart types to create visually appealing graphics. The platform provides a user-friendly interface and a range of templates, making it accessible for users with little to no prior design experience.
Datawrapper also offers a variety of customization options, allowing users to modify the design and appearance of their visualizations to match their brand’s style and aesthetic. In addition, Datawrapper provides a simple and secure way to embed the visualizations into websites and presentations, making it a valuable tool for content marketers looking to communicate complex data and insights to their target audience in a clear and engaging way.
HTML
While not as straightforward as Flourish and Datawrapper, HTML can be used for data visualization by creating dynamic and interactive graphics using a combination of HTML, CSS, and JavaScript. These visualizations can be created using various libraries and frameworks, such as D3.js, Chart.js, or Highcharts.
These libraries provide a set of pre-built functionalities that allow developers to create custom visualizations based on specific data sets, such as bar charts, line graphs, pie charts, and more. By leveraging HTML, content marketers can create dynamic and interactive visualizations that can be easily embedded into web pages, making it a valuable tool for effectively communicating complex data and insights to their target audience.
Additionally, HTML visualizations can be optimized for mobile and other devices, providing a responsive and accessible way to engage with data on the web.
Proof that it works
As an award-winning SEO agency, we understand the importance of Data Visualization in SEO and link building. Over the years, we’ve manually built thousands of high-quality links for our clients through personalized data-driven content. Here are some of our examples that have taken coverage in some of the most famous sites.
4 Higher Education Marketing Trends To Watch in 2023
In higher education and many other fields, staying on top of the industry news and trends is crucial to gaining a competitive advantage. You can benefit significantly from using a strong higher education marketing strategy that aids you in identifying opportunities for growth, generating leads, and retaining students. As an SEO agency for higher education, we know how important this is!
Read on to learn more about the current higher education marketing trends, how to adapt to digital transformation within the industry, and how to use cutting-edge technologies to succeed.
4 Higher Education Marketing Trends for 2023
The impact of the COVID-19 pandemic on higher education can be noticed in the visible shift in marketing strategies toward digital reinforcement and virtual events. In comparison to before, the path to reaching prospective students has changed. The immense use of digital platforms has necessitated a similar approach to marketing strategies.
The key to higher education success is not only accepting these marketing trends but fully embracing them. So, read on and learn more about higher education marketing strategies you can use to stand out from the crowd in 2023.
1. Student-centered content has the potential to drive significant results in higher education marketing
Considering the rising cost of education and the heavy burden of student loans, today’s prospective students are facing new challenges in deciding what higher education they should enroll in or if they should do so. As a result, higher education marketing must shift towards a more student-centered approach to drive results. Before, higher education institutes’ marketing concentrated on “this is why we are great” messages. Now, it focuses more on “this is why we are great for you.”
There are many ways you can reach prospective students by developing your brand identity, including content marketing. Quality content naturally helps boost engagement and helps build credibility. You can reach audiences on various platforms ranging from written content to audio and image.
Firstly, a common communication channel between higher education institutions and their audiences is blogs—spaces where the school can share relevant content, introduce various topics and programs, and create a community. Blogging is a highly effective tool for content marketing associated with many benefits on top of educating and engaging students. According to a study conducted by HubSpot Marketing, on average, companies that blog have:
55% more visitors
97% more inbound links
434% more indexed pages
To attract even more prospective students, you can utilize guest blogging to share content on a third-party blog. This way, you can create hyperlinks that direct visitors to your site and thus improve your visibility and web traffic.
Another format you can utilize for content marketing is podcasts. The popularity of such a tool has been at an all-time high in recent years. Statistics show that in the U.S., around 41% of the population listens to podcasts every month, with 28% doing it weekly. Because podcasts are naturally conversational, often featuring guest speakers that introduce content in a more personal way, there is plenty of room to create student-centered content.
Video content is also gaining popularity in higher education content marketing. Both long-form and short-form videos are helpful, depending on the content you are presenting. For example, in higher education, you can utilize long-form videos for personalized campus tours, explanations of the application process, financial aid explainers, tutor introductions, and much more.
Your strategy should be to create high-quality content and incorporate it within your social media posts to reach customers. Link your blogs, podcasts, videos, and more on social media sites like LinkedIn, Facebook, Twitter, Instagram, and more—provide your audience with a glimpse of the content they can access by visiting your site.
2. Use short-form videos to promote your higher ed institute
Short-form videos provide viewers with a timely snapshot of important events and programs within your school. You can accompany them with a clickable link, sticker, message option, hashtag, and more to increase engagement and stay connected with your audience.
A popular destination for such videos is TikTok which has quickly grown in popularity, with over 80 million monthly active users in the United States. An interesting statistic to keep in mind is that 60% of TikTok users are Gen Zers—a prime demographic for higher education institutions. Therefore, TikTok is an excellent platform for your university or college to connect and engage with Gen Zers as prospective students in an entertaining and relatable way.
Though you can create videos that provide students with scholarly content that gives them an idea of what your university can provide academically, it is best to mix such videos with non-academic ones. Videos focused on student experience, athletics, your university’s student services, the campus, and much more are where the real engagement opportunities lie. We advise you to involve your student body in order to present the most authentic representation of what life would be like for students at your university.
3. Consider shifting your PR strategies online in order to improve your higher education marketing efforts
You can also improve your higher education marketing by shifting your PR strategies online and collaborating with other professionals. Consider shifting your focus from school-produced content to student-focused and student-made content in order to better connect with your target audience. Furthermore, place ads on content websites typically frequented by prospective students and increase the chances of them interacting with your site.
Another element you should add to your marketing efforts is establishing ties with professionals that can help you create content as well as have an established presence on social media platforms with a dedicated following, such as:
Editors
Professors
Reporters
Student ambassadors
Leverage such tactics by embracing these influencers with the ability to reach your prospective students more effectively through their content.
4. The importance of local SEO for higher education marketing is expected to increase in the future
It is no surprise that SEO has considerable control over today’s marketing strategies, and rightfully so. It is the marketing channel that helps your site rank higher on a search engine results page (SERP) and consequently receive more traffic. However, a more recent marketing trend you should consider using is local SEO to optimize local searches. According to statistics, about 46% of all searches have local intent. Therefore, implementing basic local SEO strategies will help your site’s ranking in the local market, reaching many prospective students for recruitment.
You should work with SEO experts and devise a strong content strategy that focuses on producing content answering questions from searches near your area and containing relevant keywords so as to improve local visibility. All improvements made in your online presence within your region will help recruit local students.
Conclusion
It is clear that one must always stay updated with higher education marketing trends as the field is constantly evolving. To stay ahead of the curve, keep generating leads, attract students and retain them, you should keep up with the trends and implement the necessary practices in your strategy. Recently, for example, higher education marketing trends include the increased importance of digital marketing, especially through student-centered content, short-form videos on popular platforms, and local search engine optimization.
A well-chosen digital marketing strategy is crucial to expanding your institute’s student base. Our digital agency can help you stay on top of the current trends and be one step ahead of all that is to come. We’ll devise and implement a successful digital marketing strategy that encompasses all the above trends and much more. So, schedule a free consultation, and let us help you grow your education institution!
Manaferra Wins Best Use of Search at US Search Awards
Another big win for the Manaferra team! This time we got to bring home the Best Use of Search – Third Sector/ Not-for-Profit at U.S. Search Awards event. This award comes as a result of the hard work and commitment the team put on for the Pacific College campaign in growing enrollments through search. We couldn’t be more ecstatic about completing our We Are Search Awards Trifecta after previously grabbing wins in European and Global Search Awards events.
While the initial plan was to fly to the U.S. and attend the event in person to ‘literally’ bring the award home, we couldn’t make this possible. So, a change of plans had to occur. We were looking for alternatives to be there with other nominees, at least virtually. Still, this didn’t make it less nerve-racking and exciting.
Because of the differences in the time zone, we couldn’t watch the ceremony in real-time, but we did get together as a team and celebrated seeing our work being chosen amongst other nominees. We got one award, but it’s worth mentioning we were shortlisted in total four categories:
Best Use of Search – Third Sector / Not For Profit
Best SEO Campaign
Best Use of Content Marketing
Best Small SEO Agency
Getting recognized all over the world for the strategies and campaigns we come up with is an enormous success. The judges remarked, “This was a well-rounded campaign pulling all the SEO levers to achieve its objectives. We admired how they accomplished their goal of showcasing how a good SEO campaign can yield even greater growth than PPC. It was also very well targeted to its prospective audience. Excellent job!” Receiving this kind of feedback will be our ultimate goal as an Higher Education SEO agency. I am super proud of the work delivered and the team behind it.
Faton Sopa, Co-Founder & CEO
Manaferra
It is quite an achievement for us to be one of the agencies from Kosovo making a breakthrough in American land and being held in high esteem in the SEO field. We are proud to be recognized as one of the best in the industry and will continue to provide the highest quality services for our clients.
Going back to the event itself, U.S. Search Awards are part of an annual international awards series. The event aims to reward American agencies that significantly contribute to the Search industry. Here is the whole list of this year’s winners.
Congratulations to all those who made it, and a big thank you to the U.S. Search Awards.