
As an agency that specializes in Higher Education SEO services, we know how important it is to stay on top of the latest trends and tools. As digital transformation continues to reshape the industry, university administrators and marketers must continually analyze user behavior, monitor ROI, and devise effective marketing strategies. One of the most widely-used tools for this type of analysis is Google Analytics.
Since Google Analytics’s inception in 2012, many things have changed with the rise of mobile apps, consumer behavior shifts, privacy regulations, big data, and the way we collect and analyze data. Google needed to consider and reflect on how its current Analytics tools evolved to fit market changes and demand. This must have required a 10.000-foot view of the whole spectrum, starting from how the data are collected and presented, to deliver seamless insights and data-informed decision making.
Saying that Google Analytics 4 is an update or an upgrade from Universal Analytics would be an underestimation of reality. The best way to think about it is as a completely new product, built on a different data model, made for scalability, machine learning, privacy, and customization.
To understand how those two versions of Google Analytics differ from one another, we will break down some of the main differences, so you can have a clear picture of the new platform before starting to migrate to GA4.
The ability to analyze data depends highly on how those data are collected and organized in the first place. The better they are organized, the easier it will be to make further data manipulation and analysis.
Data collections represent a fundamental difference between Universal Analytics and Google Analytics 4.
Universal Analytics (or GA3) organized all of its data into Sessions and Hits. All information that went to Google Analytics belonged to a Session, which belonged to a User. This data modeling doesn’t give you much space to collect and organize information around your users and their behavior, especially across multiple devices. That’s because you had numerous data layers that were not communicating with each other, and making it work required A TON of custom work.
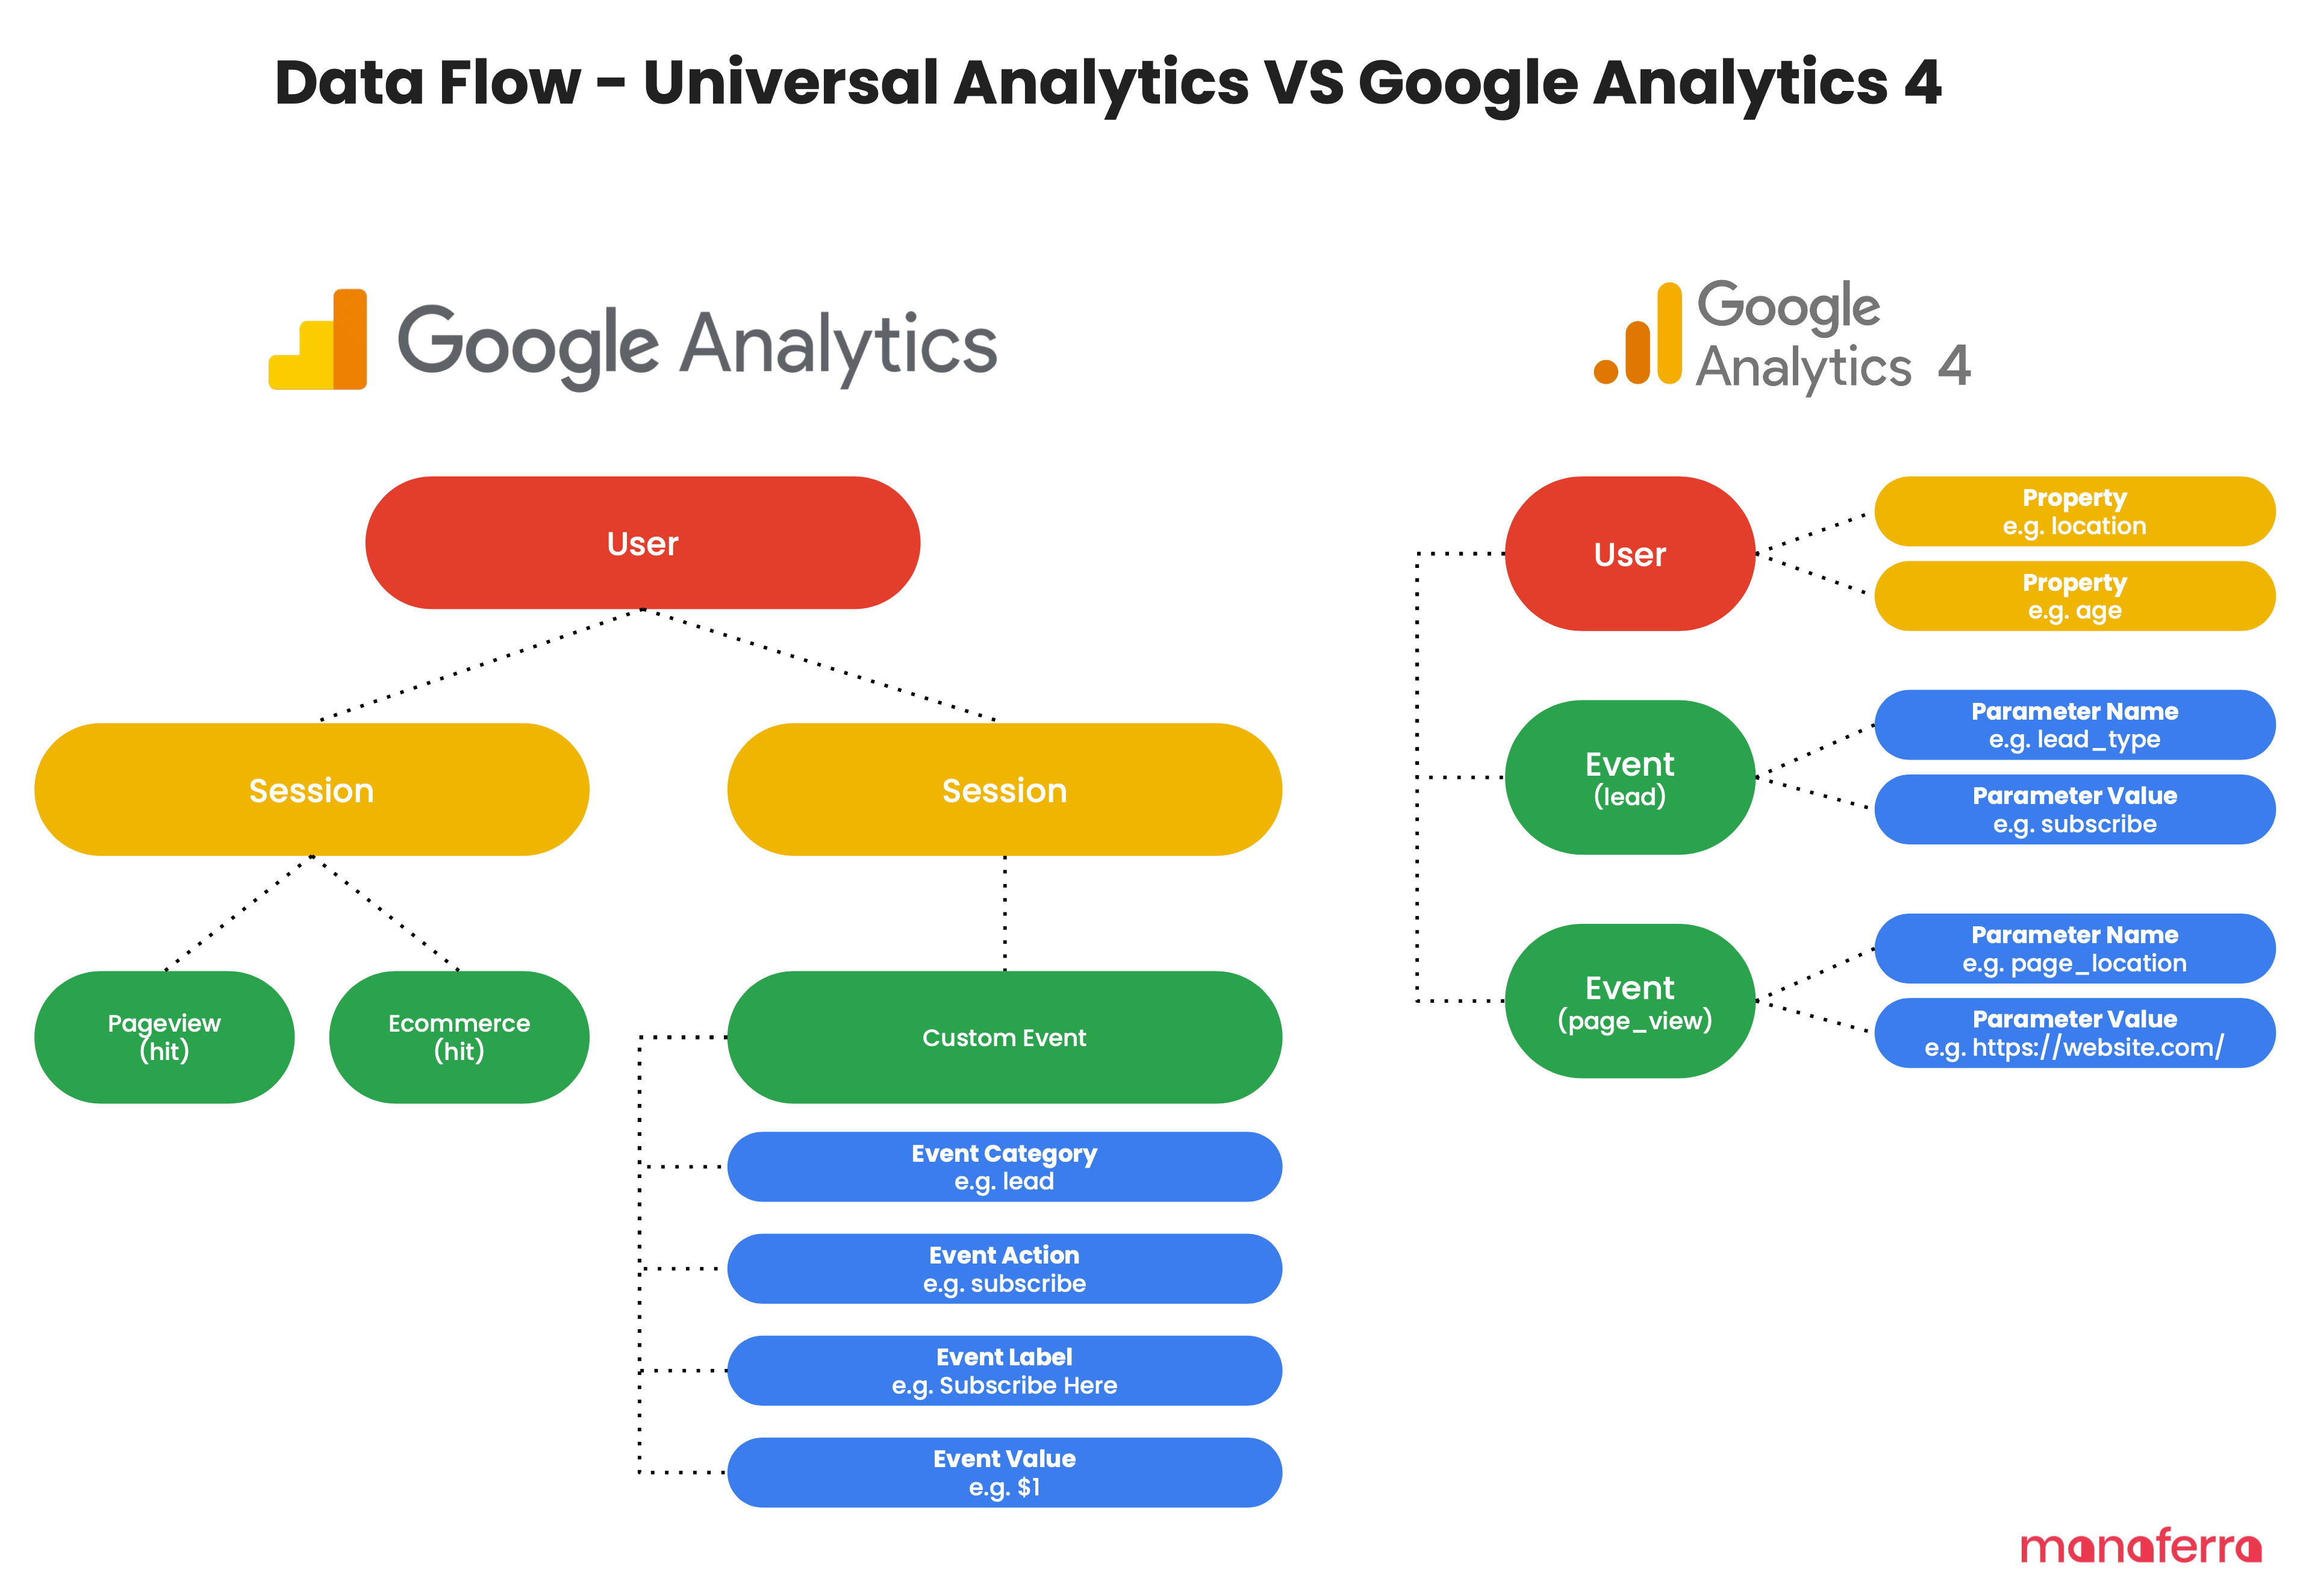
On the other hand, Google Analytics 4 has an entirely different data model, which is simpler yet powerful. Any interaction on your Web or Mobile is organized under Events (Event scoped), which belongs to a User (User scoped). A Session is an event, a Page View is an event, a File Download is an event, an Ecommerce sale is an event, and so on, you get the idea.
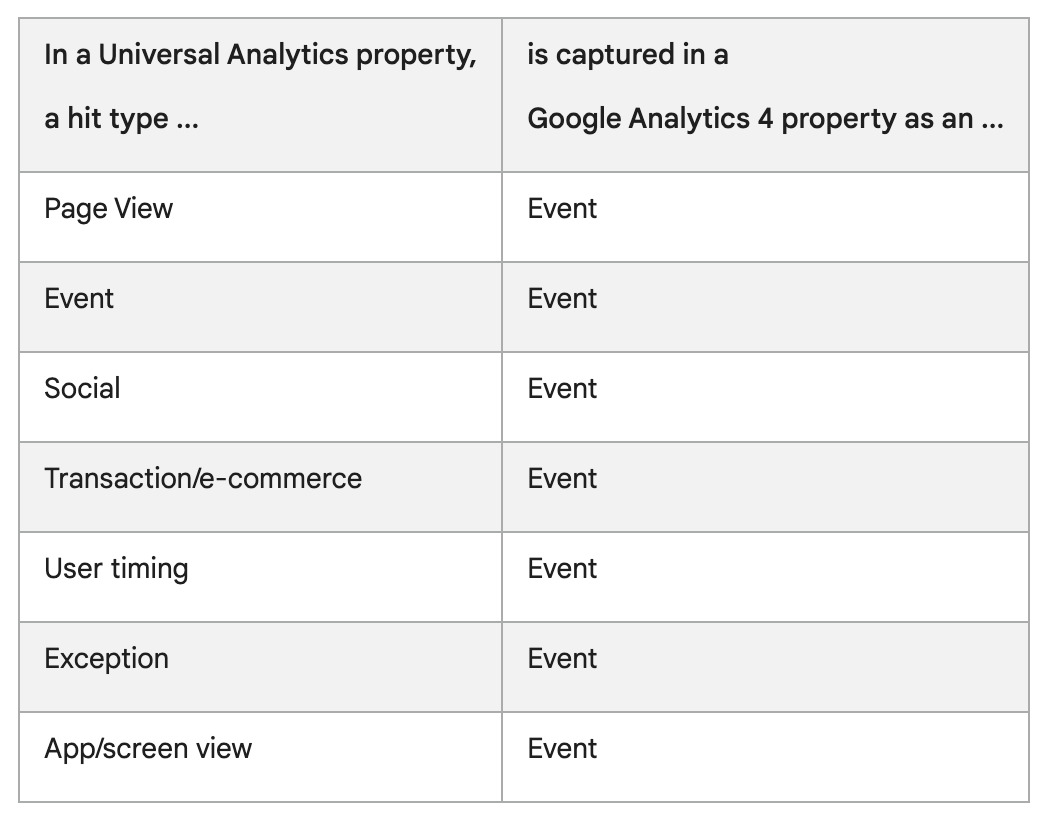
In GA4, when someone views one of your website pages, a page_view event is triggered, and that event will be saved under a specific User in GA4. Here is how previous hits translate to Events in GA4.
This data collection model gives Google Analytics 4 an edge over its predecessor in analyzing user behavior across multiple devices and building custom reports. This is because GA4 can link all interactions to a User, and enables you to organize them the way it fits your needs. That’s why GA4 needs more customization setup than GA3, where you had a ton of pre-defined reports built with a “one size fits all” approach.
One of the most significant changes from UA is user data retention, or “how long does Google save user interaction data”. In UA, the default option for data retention was “unlimited”; however, in GA4, the longest you can hold on to Events and User data (including conversions) is 14 months.
Having a maximum of 14-month-old data might freak out a lot of higher education marketers as they won’t be able to make YoY comparisons; however, there are workarounds to this, such as integrating GA4 with tools like BigQuery and reporting them via tools like Google Data Studio. BigQuery allows you to export raw data unsampled to conduct a much more granular analysis with confidence in your data, which I highly recommend before your data expires from GA4.
This limitation in data retention does not apply to standard aggregated reports, where you will be served reports based on sample data.
Google uses Machine learning (ML) on GA4 to fill in data gaps and make predictions by looking for patterns, feeding those data into AI algorithms, and predicting the future behavior of your users.
However, In a cookie-less and privacy-conscious world, tracking users’ activities is not something platforms like GA4 can ignore, and that’s where Machine Learning comes in. It fills out the data gaps and provides predictions by putting users into different cohorts and creating a composite overview of how people with certain traits move through your university website.
This is very helpful for universities as it allows them to predict their university’s growth by making predictions on potential students (leads) you could get next semester. If you have conversion rate data from your past activities, you can easily make necessary calculations that would lead you to predict enrollment numbers.
Machine Learning also powers up Automated Insights, which helps you observe trends and keep an eye on changing user behavior. For example, you can be alerted to changes in application numbers, which might lead you to understand that the application form isn’t working as expected.
Recommendation:
Do not forget to create anomaly detections when you set up GA4.
Cross-device tracking is at the heart of GA4. The new data model enables GA4 to consistently store data from multiple sources and report them back into the same Analytics property for further analysis.
GA4 bases its cross-tracking mechanism on something called “Identity spaces”. It tries to identify a user using multiple data points without revealing their identity. This is done by using three different types of identifiers, which enables it to stitch them together into a single unified cross-device user journey:
GA4 creates a single user journey from all the data associated with the same identified identity. Because this identity is used in all reports, they allow you to de-duplicate users and tell a more unified, holistic view of their relationships with your university.
For example, suppose your university offers a login area for your students. In that case, you can assign User IDs along with the interaction data you send to GA4 when a student enrolls (you might need the help of a developer to implement this) and later map the entire journey of that student in Analytics.
If you don’t have a User ID to assign to events, you can enable “Google signals” and all data sent to Google Analytics will be associated with that user. However, Google will only be able to assign these User ID’s to signed-in users who have consented to share this information.
If you do not enable Google Signals, the only option left for Analytics will be to identify users based on Device ID; however, that alone might not be enough to allow cross-device identification.

GA 4 lets you build custom audience segments based on your site visitors’ behavior and interests. They are groups of users created based on dimensions, metrics, or events that you can use during your analysis and show ads to them via Google Ads.
As your Google Analytics keeps receiving data about new users from your university website, audiences are constantly reevaluated to make sure that they meet the criteria you had defined when you created that audience.
You can use your custom audiences in Google ads only if you have linked GA4 property with a Google Ads account (and you have also enabled Google Signals),
For the time speaking, GA4 lets you integrate your analytics data to more than ten other tools, including some tools of its suite. However, GA4 is still under massive development, and we expect to have more integrations available soon.
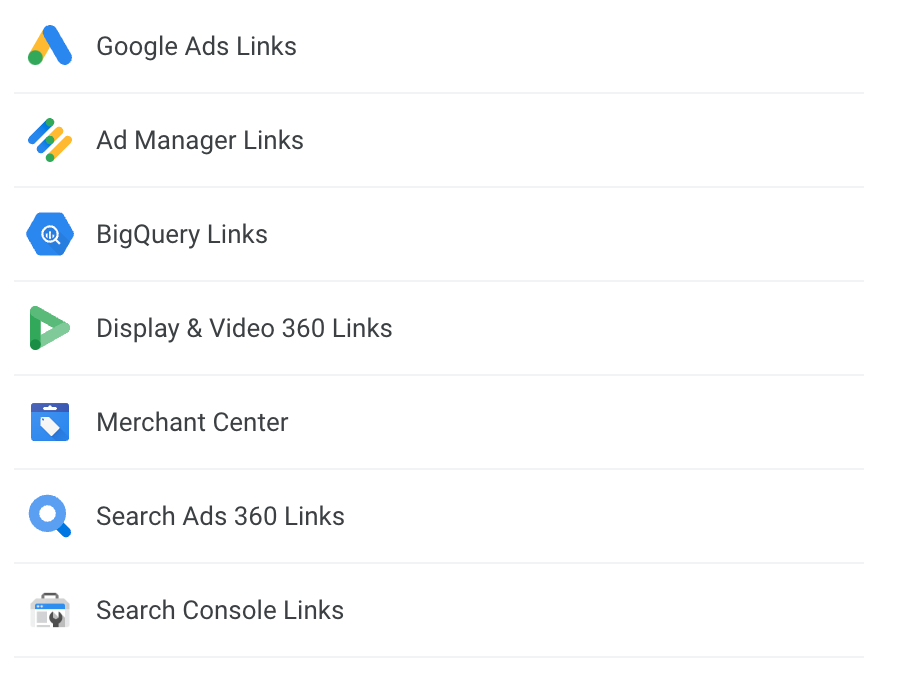
These integrations mean that you can synchronize data between GA4 and another tool of your choice to make robust analyses and facilitate your decision-making process. For example, you can link GA4 with Display & Video 360 or Google Ads to see the entire student cycle, from how your future students interact with your ads to how they finally complete the Request More Information form on your site. You can also use your custom audiences for display/search advertising and synchronize conversions between two platforms.
To deal with the data retention limitations, you can connect GA4 with Big Query, and store all Analytics data in BIgQuery. Once you connect to Big Query, you are the sole owner of that data, which you can use to make further in-depth analysis and YoY comparisons. This is a paid tool, but its cost is super cheap. I have data assets that constantly process more than 1TB of data, and I have never spent more than $10/m. Yes! That’s how cheap it is.
If there is one recommendation I would make about integrations, is to connect your Analytics with BigQuery ASAP so you do not start to lose important data when you reach the data retention limit (which is 2 or 14 months, depending on how you configure it)
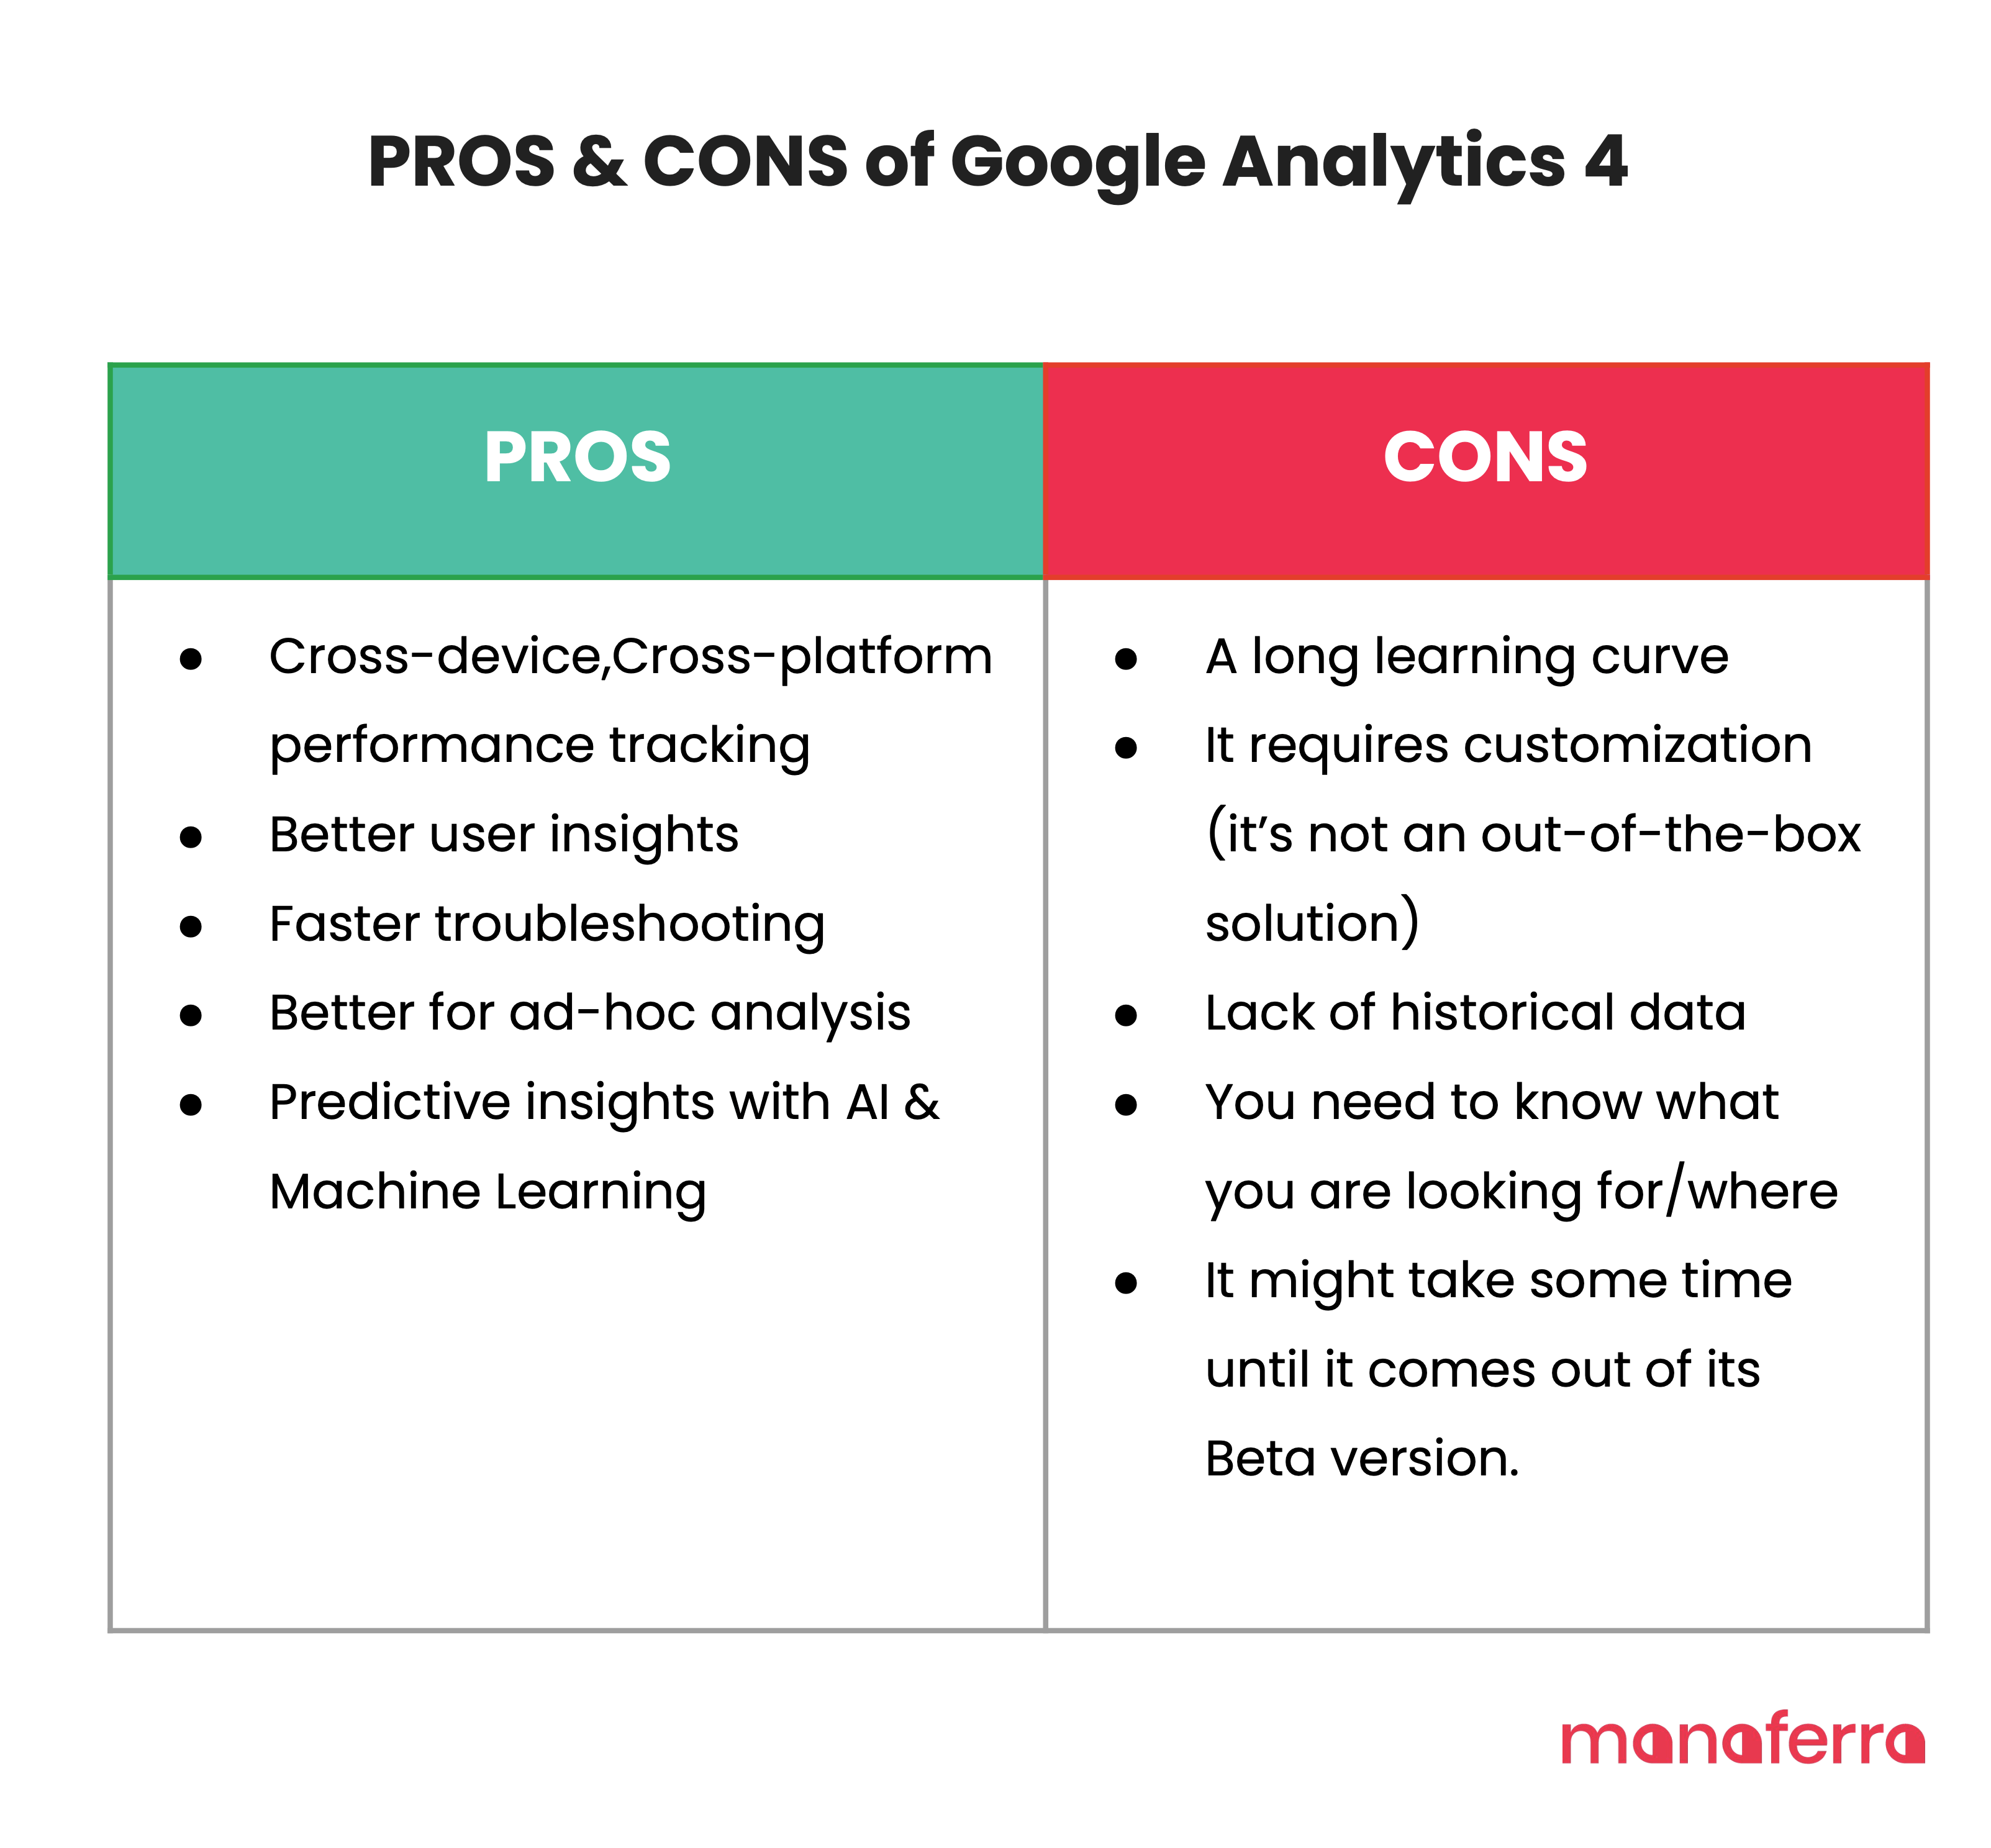
As with every tool out there, GA4 has its pros and cons. It’s a constantly evolving and improving tool that will take some time for you to adapt as a higher education marketer.
On the PROS side, this entirely new Analytics product outperforms its predecessor in many areas. Its extra layers of analytics capabilities are built for a world where data and marketing are increasingly crucial for the success of higher education institutions.
On the CONS side, there are some things you might need to consider before taking the next step of migrating to GA4. Because GA4 is built on a data model made for scalability and Machine Learning, it’s not an out-of-the-box solution that you can meaningfully use right away after you set it up. You need to tweak it based on your needs and build custom reports (most of the reports you are used to seeing in Universal Analytics do not come out of the box in GA4). You might need to be patient as you go through the learning period (it will take some time, trust me) and let the data flow within the tool, so you benefit from AI/Machine Learning capabilities of GA4.
Now that you have a bigger picture of how GA4 works let’s dive deeper into how to set it up so your university can take advantage of all the new features that the tool offers.
If you are reading this post by the middle of 2022, the chances are that Google Analytics 4 is still not mature enough to be used as a standalone analytics tool. Hence, you should use both tools (UA and GA4) at the same time so you feed data into the GA4 ASAP, but at the same time, use the reporting you are currently using in Universal Analytics (so that you can make the transition easy for you)
However, if you are reading this post in late 2022 or even more in the future, it will probably be mature enough for you to switch to Google Analytics 4 completely.
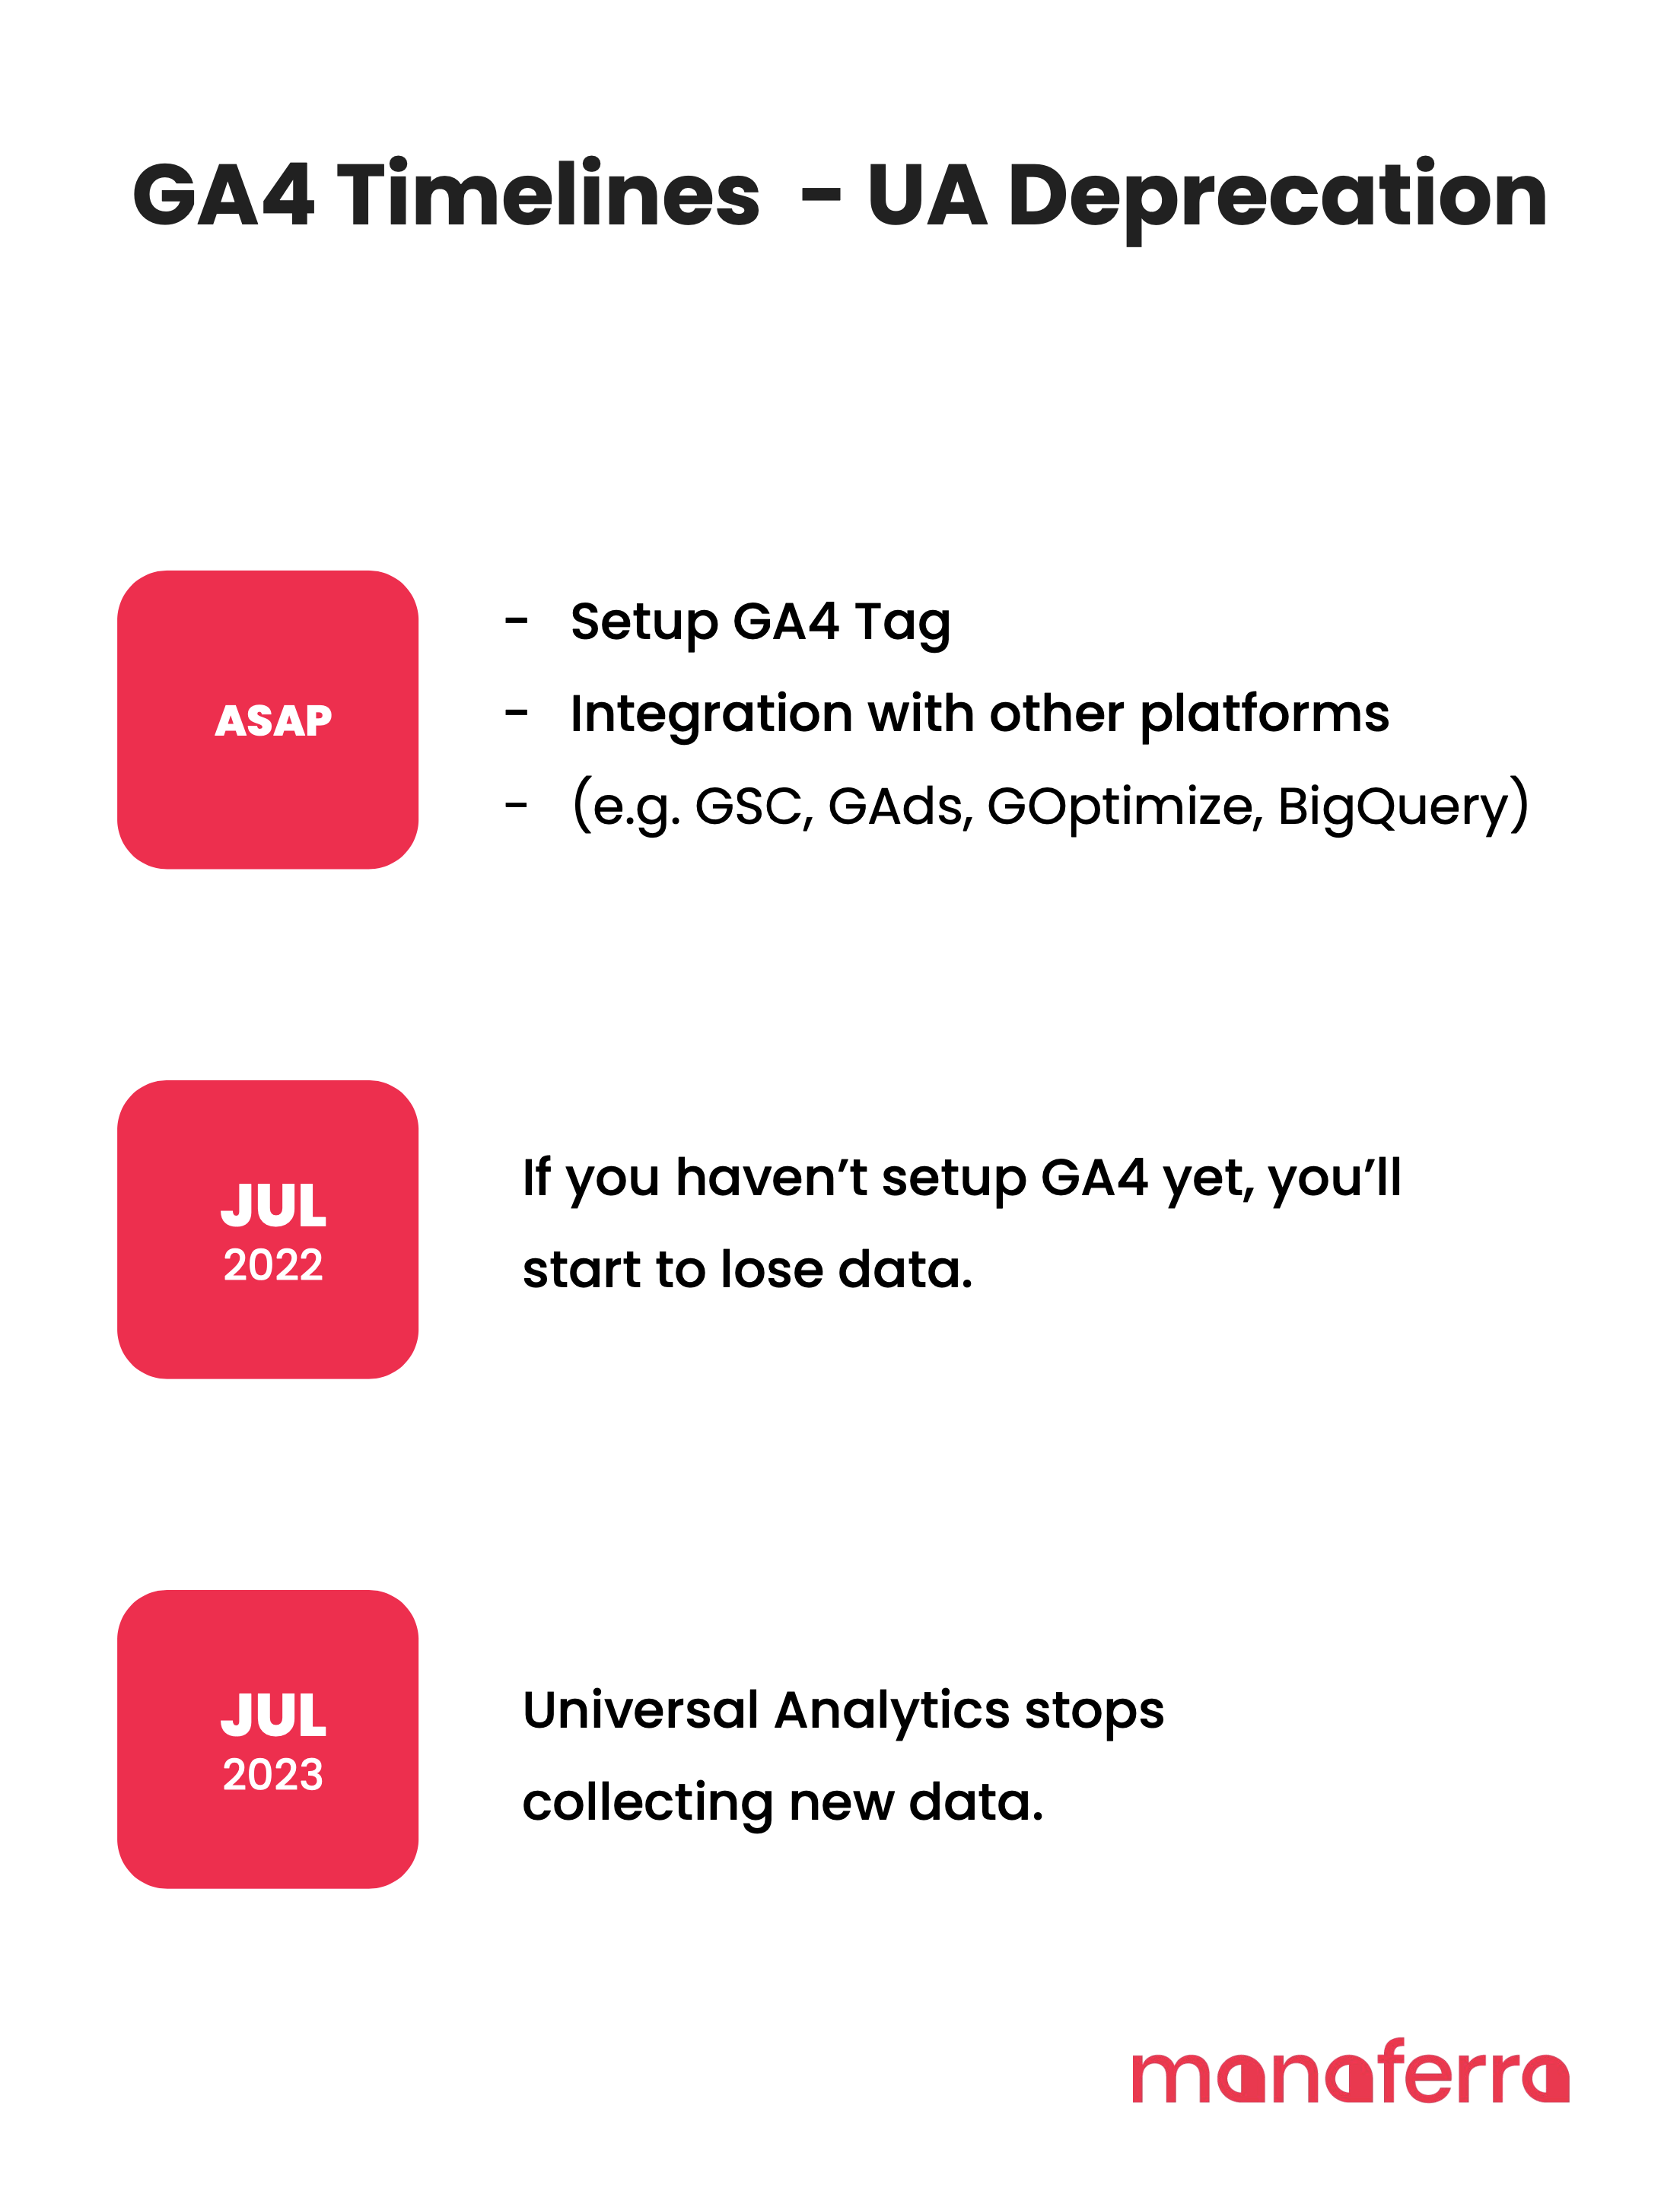
UA will stop collecting new data from July 2023, so every day of not setting up GA4 means a day less with data you could use for analysis and decision-making. So make sure you are pushing data to your GA4 account ASAP. Otherwise, you will lose YoY data.
Let’s learn how to set up the GA4 account first.
There are two ways you can set up a GA4 account. One option is to create a whole new property (it will be a GA4 by default), and the other option is to use GA4 Setup Assistant. This time, I’ll focus on creating a whole new property because the result will still be pretty much the same, and I can walk you through the entire process.
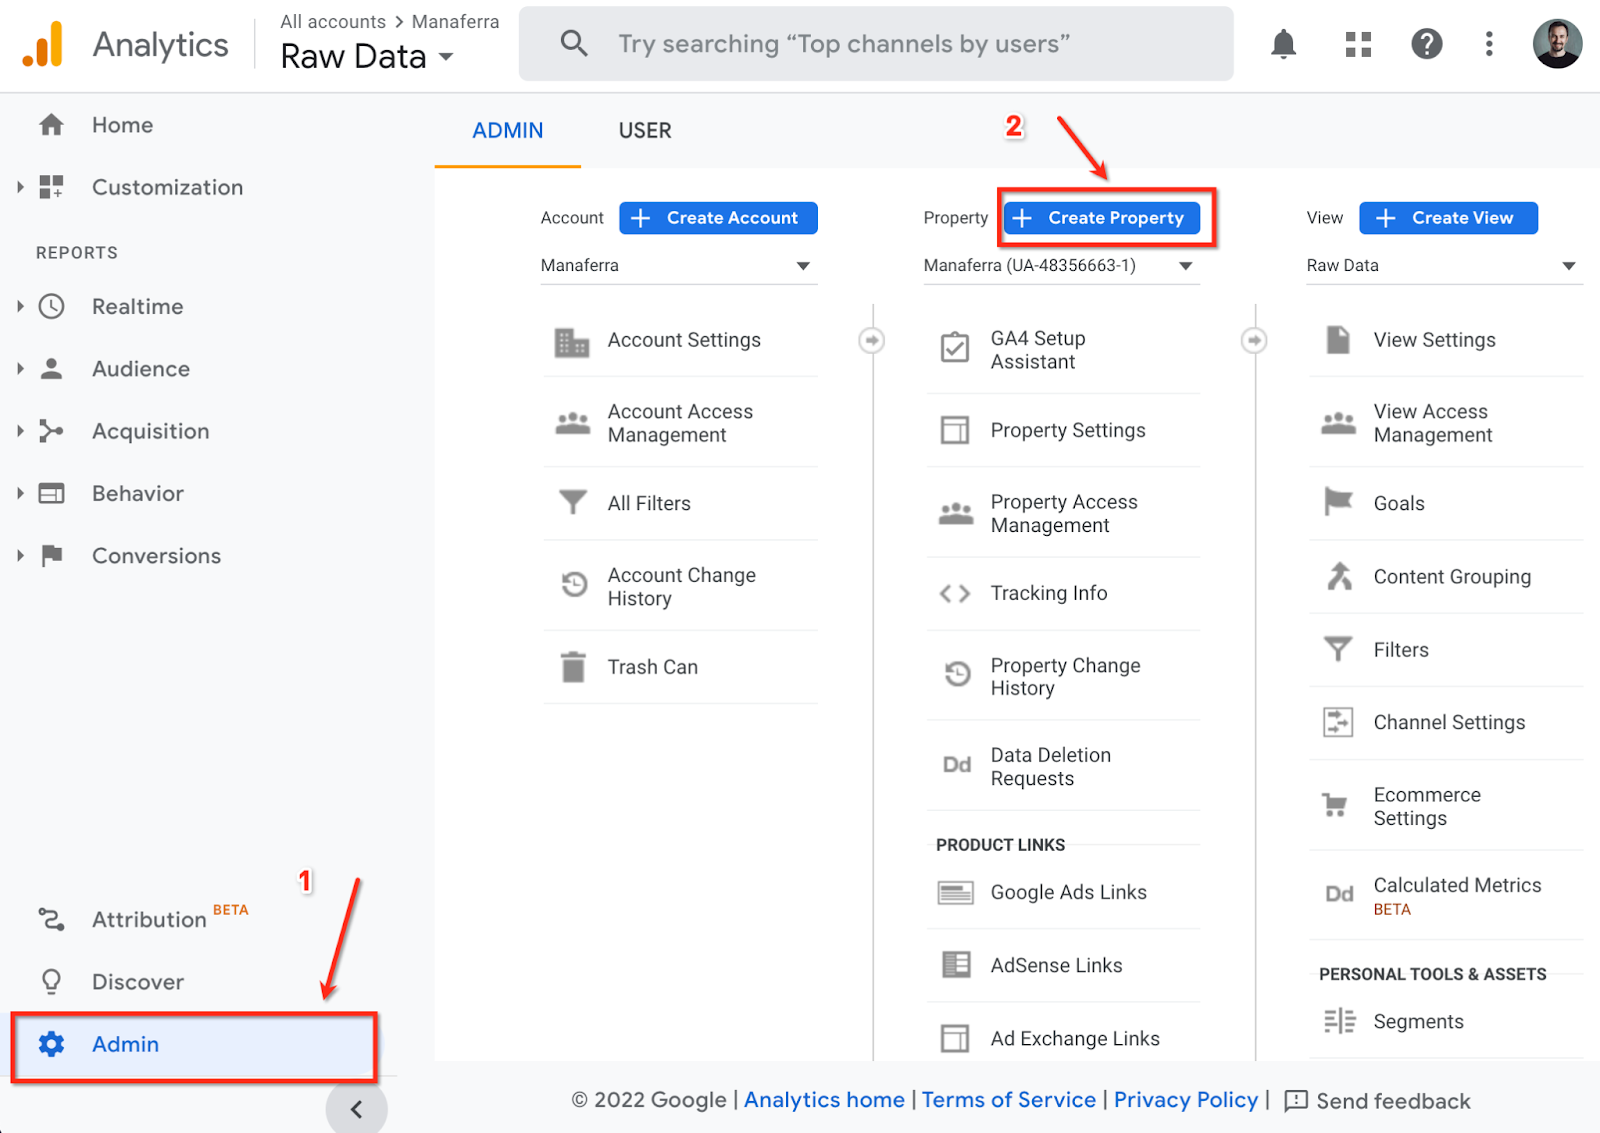
Go to the Admin section of your Google Analytics interface (by clicking the Admin at the bottom-left corner) and then (in the Property section) click Create Property.
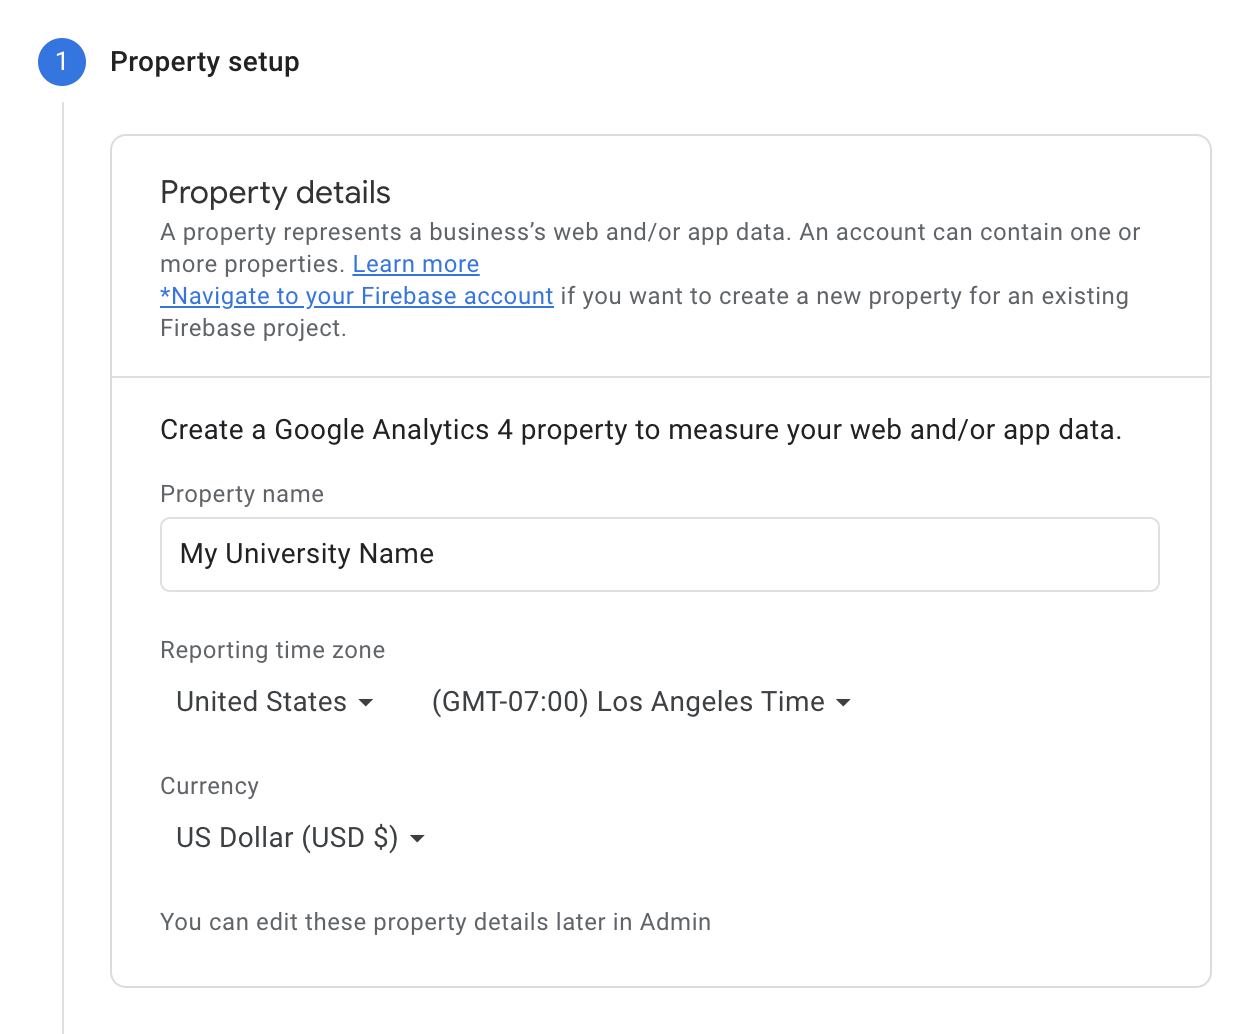
Then enter the name of your University, choose your University’s main campus country, reporting time zone, and the main currency your University operates in, and click “Next”,
Then, fill out your business information. Suppose you are a university of 11-100 employees. In that case, we recommend the following setup, as GA4 will adjust some configurations and enhancements based on the category of the business and the intent of how Analytics will be used.

Once you click “Create”, your GA4 property will be ready. However, there are still some setups you need to make to start using it.
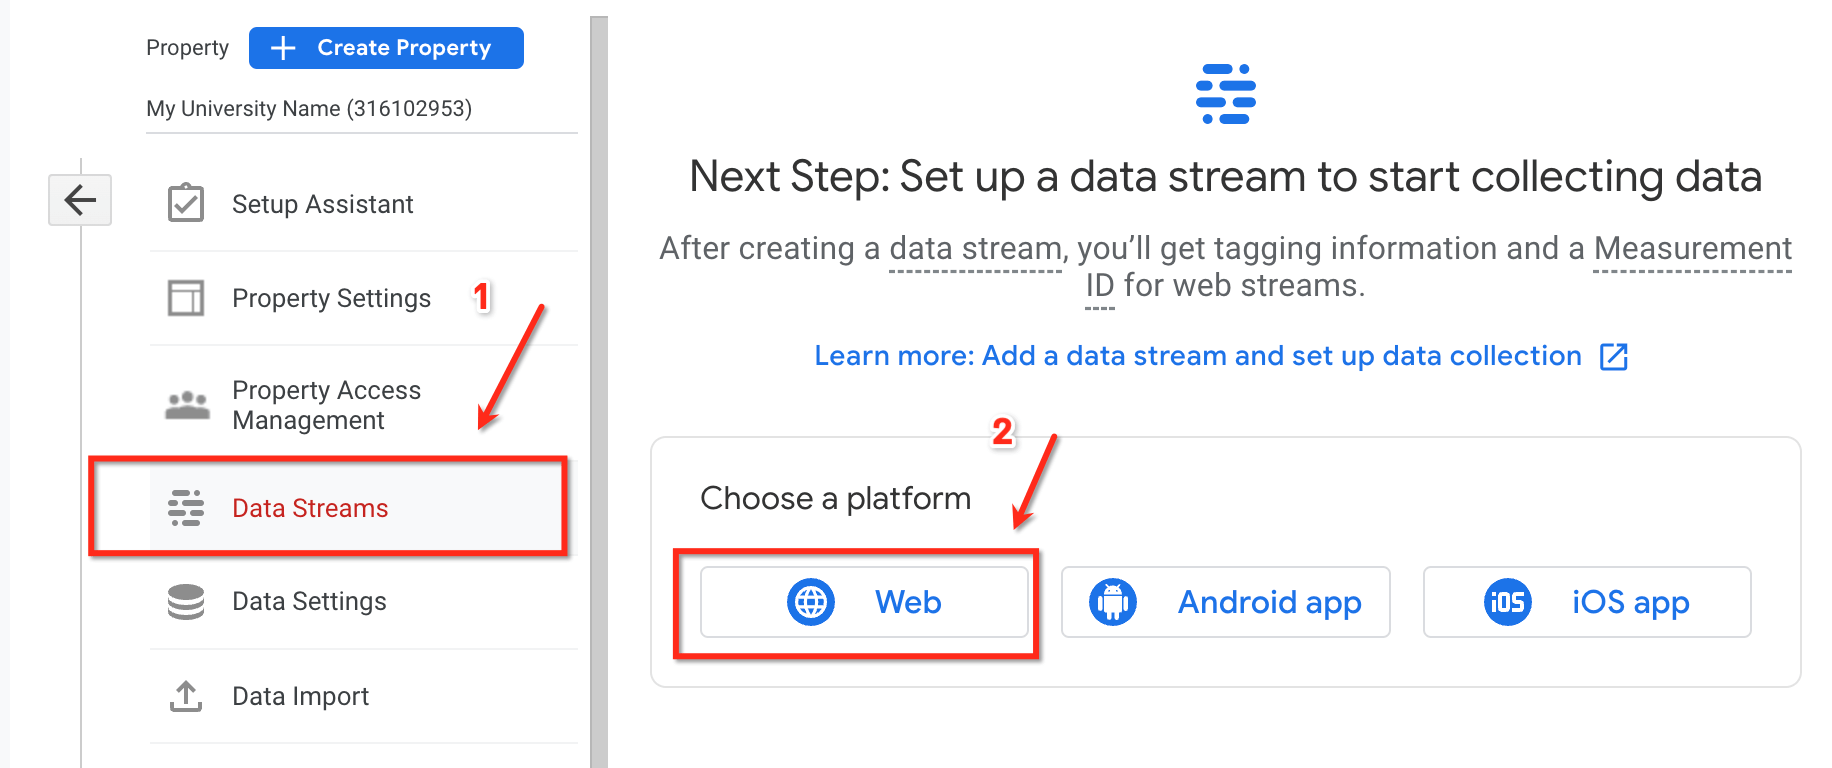
The next step to complete is to configure your first Data Stream. This tells Google the data source from where it will get the data before sending it to your Google Analytics 4 property. You can have multiple data sources in a single property. For example, three web properties, 1 for the Web, one for an Android app, and 1 for an iOS app. However, for most universities and colleges, 1 Data Stream (web) will be enough.
While on the property that you just created, click “Data Streams” and choose “Web”
Once you enter your university Website URL and Stream Name (Example: My University Name – Website), you will be able to enable/disable default events that come as part of “Enhanced Measurement.” These out-of-the-box events that GA4 automatically sends to your data warehouse without requiring you to implement them via GTM or asking a developer.
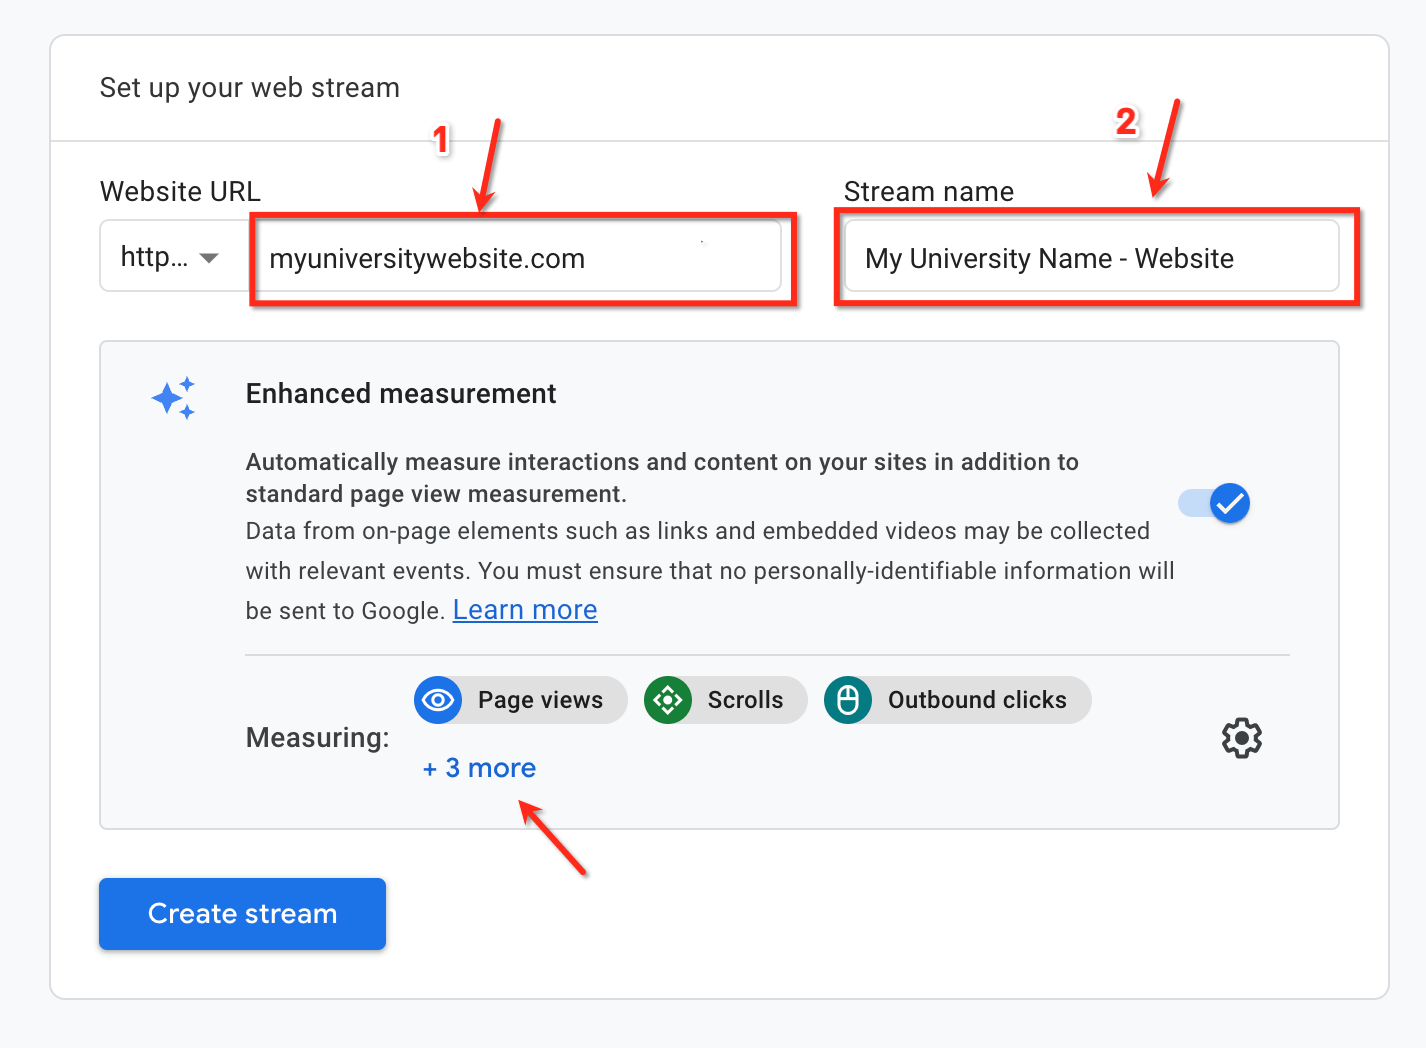
When enabled (which is the default option), Enhanced Measurement will automatically track the following events for you:
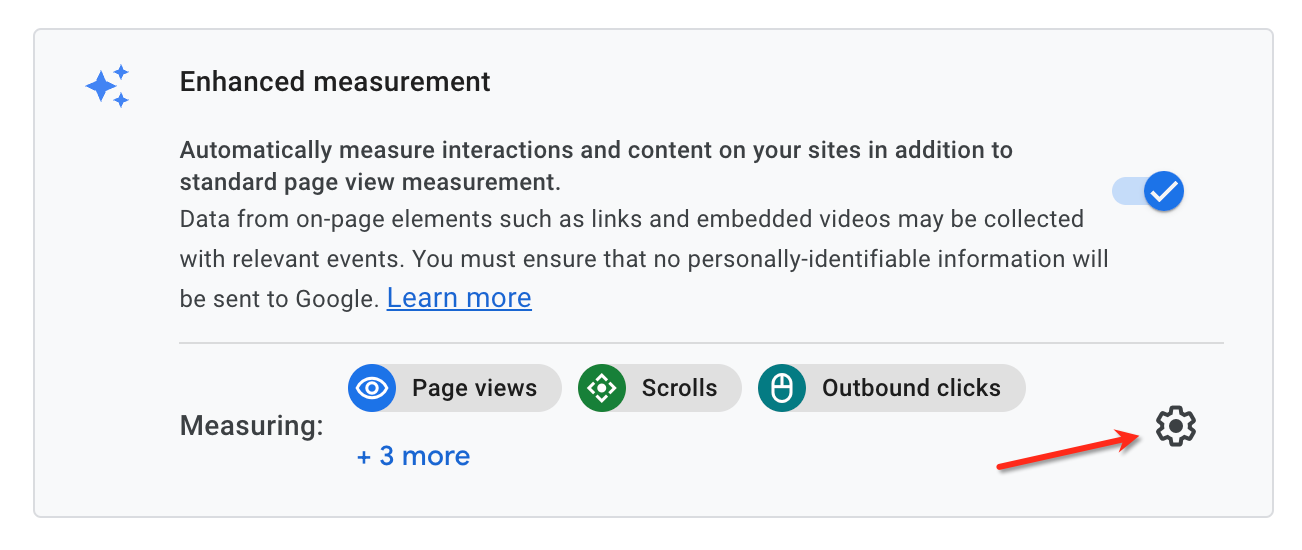
If you prefer, you can enable/disable such events manually by clicking the gear button on the right bottom side of the gray widget
When you are done with the above configuration, click the “Create Stream” button, and you will automatically be presented with tagging instructions.
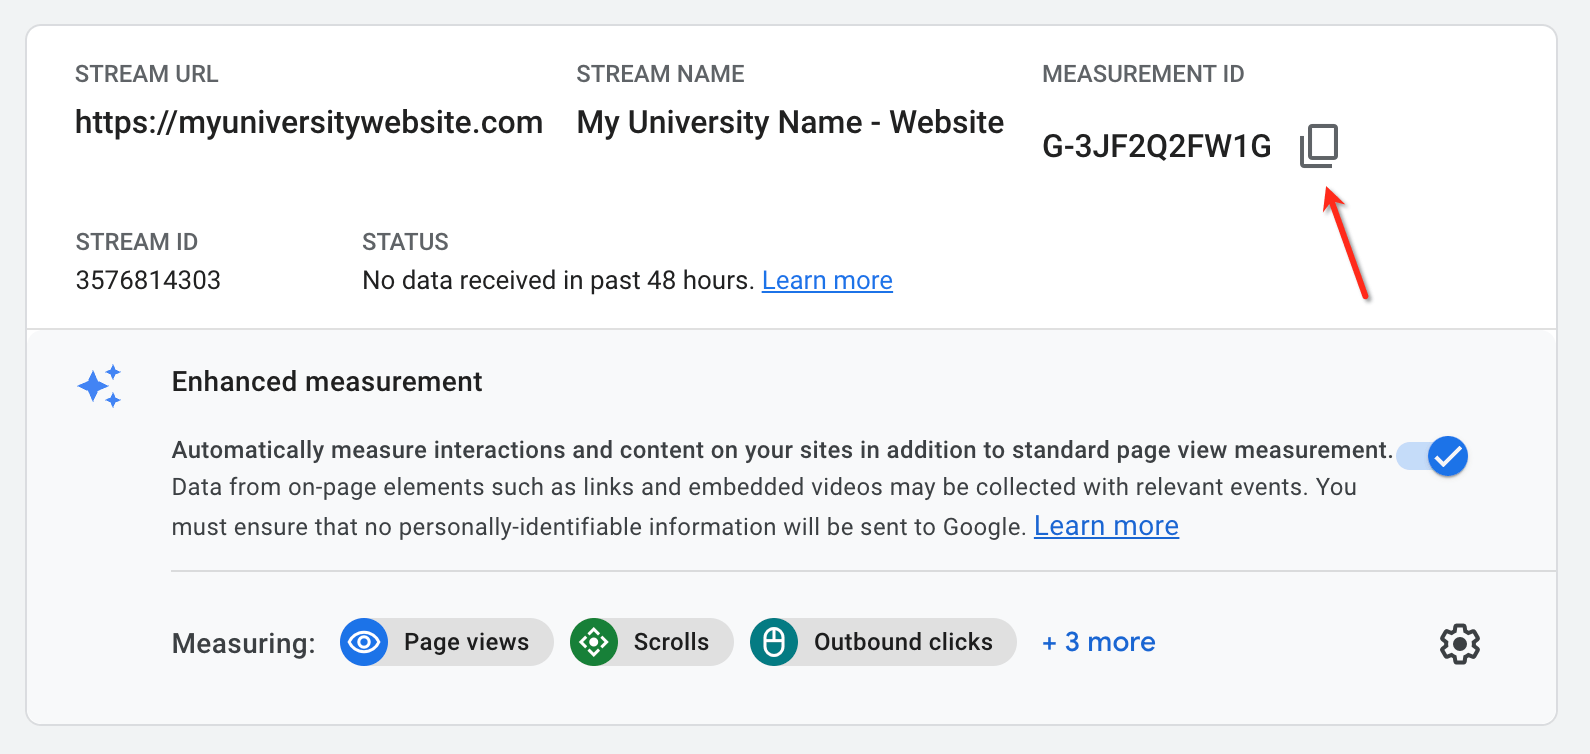
Each of your Data Streams has a unique “MEASUREMENT ID” that you will need to use to send data right into your Google Analytics account. You can install the GA4 tag manually on your website or use a platform like Google Tag Manager (our recommended way).
If you are doing this in 2022, MAKE SURE your Universal Analytics code is still running so you are collecting data for both UA and GA4 simultaneously.
Let’s see how we install GA4 via Google Tag Manager
While on the Data Stream details page, copy the “Measurement ID” as you will need this to add to your GTM account.
Go to your Google Tag Manager container, click “Tags” -> New” and on the “Tag Configuration” box, choose the “Google Analytics: GA4 Configuration.” tag.

Enter the ID ID in the Measurement ID field that you just copied in the GA4 interface. If you want GA4 to track pageviews automatically, keep the “Send a page event” enabled. If your website is built as a Single Page App (ask your developer), you might need to disable the “page_view” event as it will not get consistently fired on the user navigates on your site.
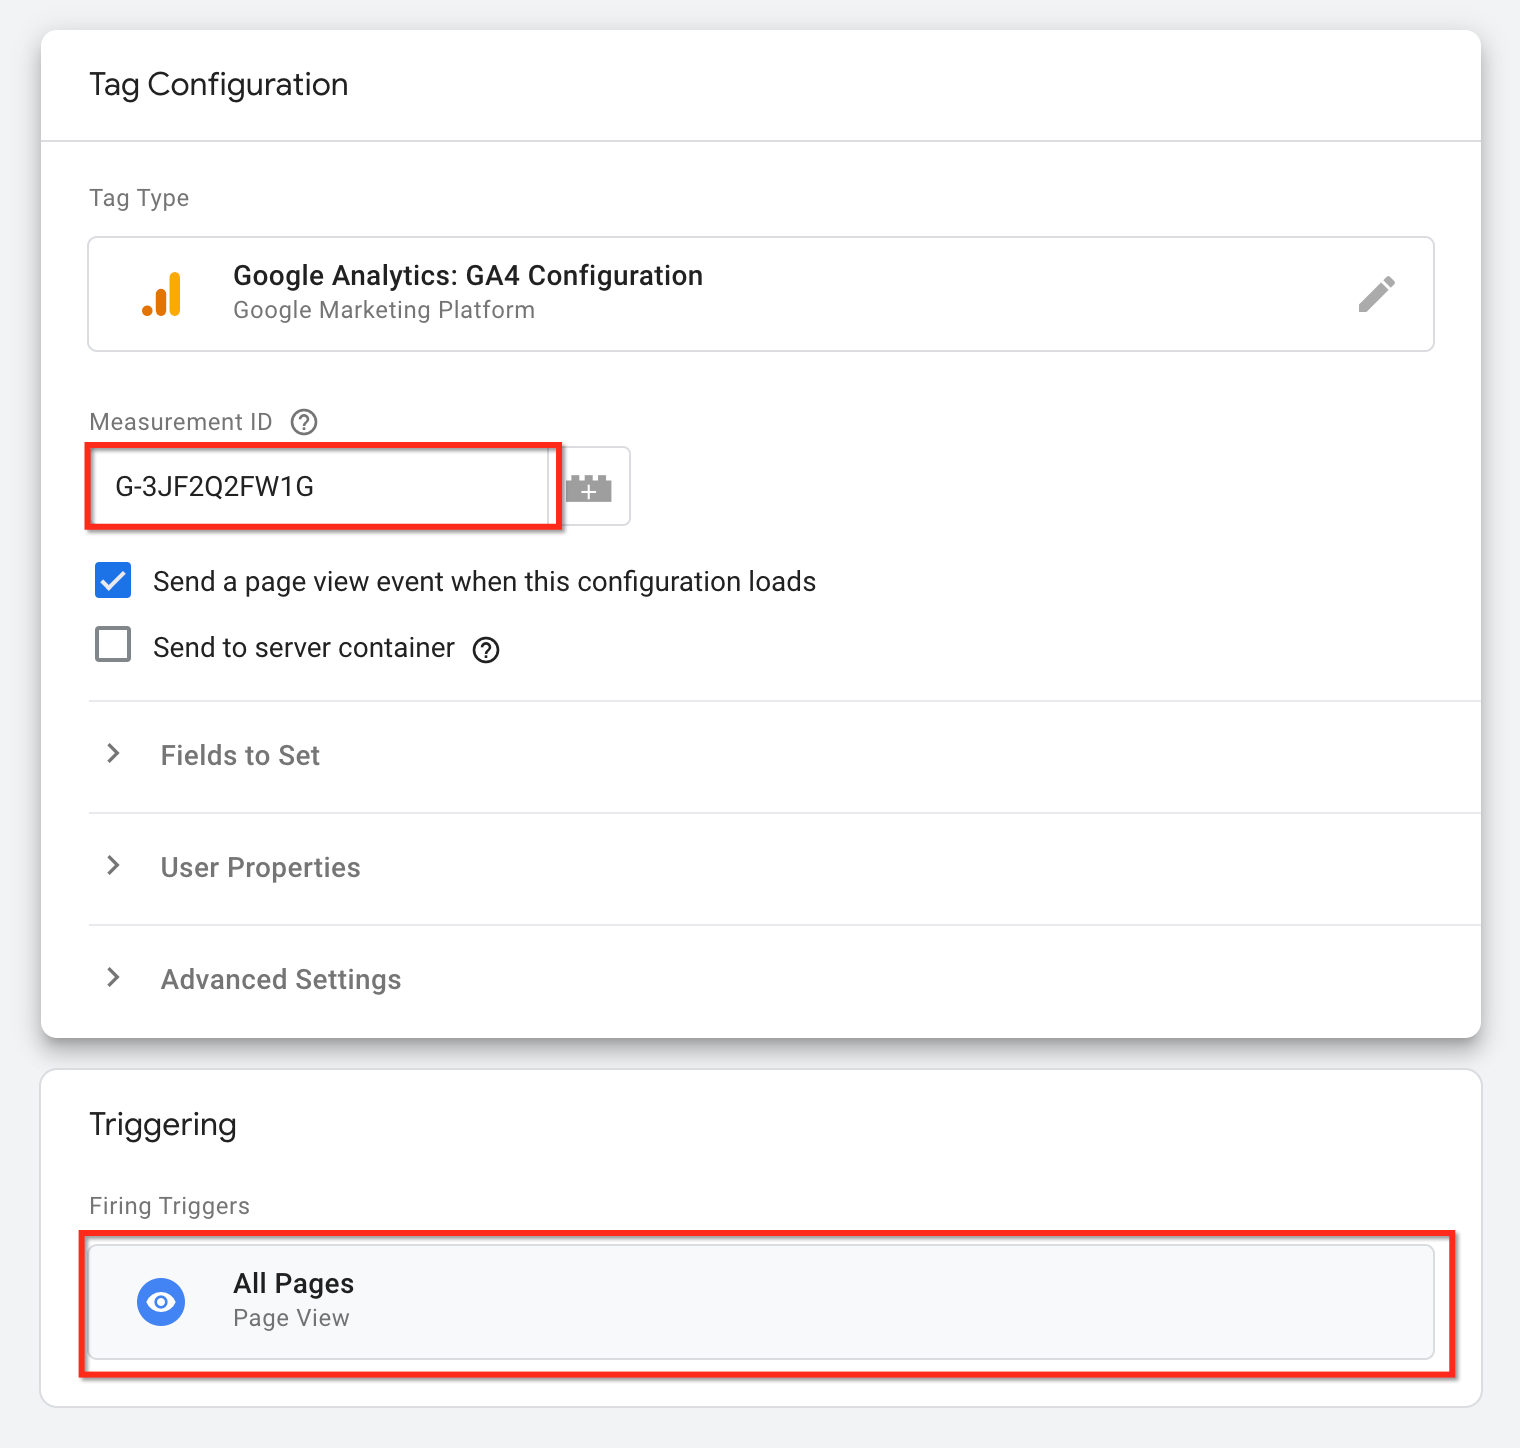
In the Triggering section, select “All Pages,” click “Save,” and then name the tag according to your naming convention: “GA4 Configuration – G-{your measurement id}”
Let’s test our integration.
While on your GTM, click the “Preview” on the upper right side of the windows, and you will be able to enable GTM Preview mode to test the integration.
Once you type your website URL and click Continue, you should see the new GA4 tag among the fired tags.
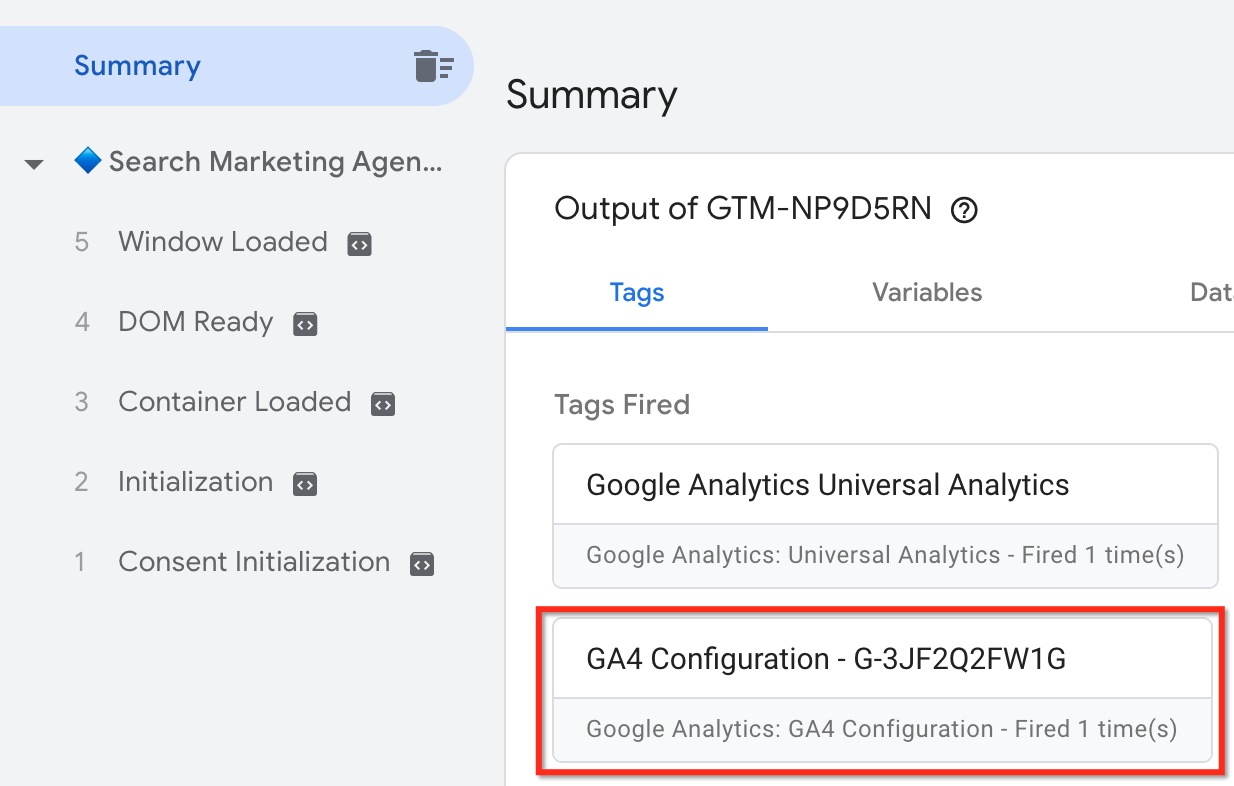
Once you see your fire being fired in GTM Preview, ensure the event is being sent to GA4. You can test it by going to GA4 -> Configure -> “Debug View” and waiting for events to fire (you might experience some seconds delay until the data starts to appear in Debug View). If everything has been appropriately integrated, you will see something like this:

Once you ensure that the data is coming in and shown correctly in GA4, you should submit your GA4 changes in the GTM container and publish it.
To publish changes, go to your Tag Manager container, and on the top right side of the page, click “Submit”, type a version name of the deployment (optional) and a description of changes you have done (optional), and click the “Publish” button.

When you publish changes, you should soon start seeing data coming in your GA4 real-time reports.
Congratulations! You have just set up GA4 with Google Tag Manager. However, GA4 needs a lot of customizations, remember?
There are two ways you can add a GA4 tag on your WordPress site. One is by placing a direct “gtag” code directly on the <head> HTML part of your website, and the other is by installing it via a plugin. Let’s cover both of them.
Go to your GA4 Property and click “Data Streams”, and choose the Website data stream you just created to get stream details.
On Tagging Instructions, copy the Global Site Tag and place it into the <head> section of your HTML code (you might need the help of a developer to do this)

Migrating from Google Universal to Google Analytics 4 is no simple task. Sure, account setup is relatively straightforward, but setting up the proper conversion tracking is much more complicated now. Google Analytics 4 has its advantages and disadvantages, but like all new forced changes, it will take time to get used to. Google Analytics 4 will actually be an improvement on your analytics data as it is based solely on events and parameters.
Let our team of Google Analytics 4 experts do the heavy lifting for you.
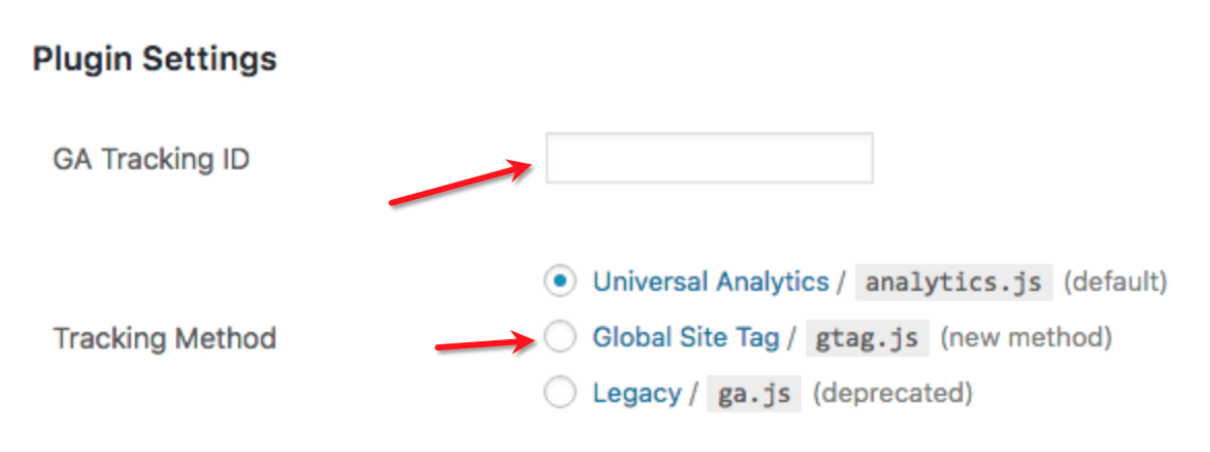
You can use multiple plugins to install the GA4 tag on your University Website. However, we recommend using the “GA Google Analytics” plugin as the most straightforward WP plugin to integrate Google Analytics into your WordPress website.
Once you install the plugin, go to its Settings page, add your tracking Measurement ID under “GA Tracking ID” select “Global Site Tag” and then click “Save Changes”.
That’s it! You have now installed GA4 on your WordPress site. Make sure you receive real-time statistics by going to your GA4 -> Home and see if your current traffic is being reported.
If you use WIX on your university website, you need to add your Measurement ID on your Marketing Integrations page. You can do it by following the instructions below:

Congratulations! You have just installed GA4 on your WIX site.
Squarespace has a built-in feature to connect GA4 without too much hassle.
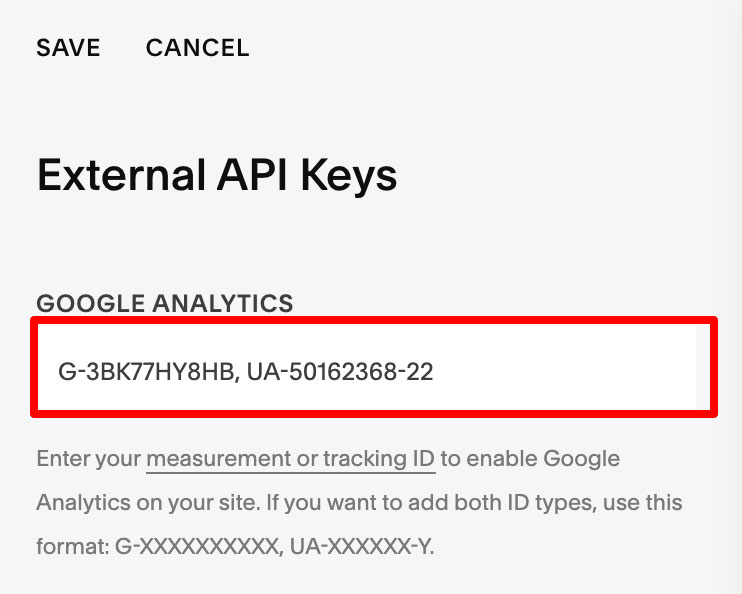
To install GA4 tag on your Squarespace site, follow instructions below
You can paste both UA and GA4 code on the same field, separated by a comma..
Test your installation by opening your website URL in a new window and opening the GA4 -> Home report to see your real-time statistics.
Filters in GA4 allow you to limit or modify the data before entering your Analytics account, and they do not work retroactively. Unlike Universal Analytics, where you could create a “raw view” account without filters and another one with certain limitations, filters on your GA4 are applied at the property level. As we are writing this post, there are no Views in GA4. That makes testing your filters in GA4 more critical than in Universal Analytics.
Currently, there are only two types of filters in GA4:
Develop traffic is the traffic generated by your website administrators/developers while developing or debugging the website.
This is done by adding a specific event called “debug_mode” or “debug_view” (with a value of 1) every time your GA4 code is executed during your developing/debugging sessions. You will still be able to watch that traffic coming through in Configure -> Debug View, but you will not be able to see it across other reports in GA4.
This is the traffic generated by people directly or indirectly connected to your university who are not your targeted audience. Those can include your faculty members, administrative staff, services providers, and vendors. As such, including their traffic in your Analytics can skew your analysis.
Currently, you can only filter your internal traffic by IP addresses (way more limited than it used to be in UA). To do that, you should:

Because of the way Universal Analytics was built and its data structure model, there were quite some limitations regarding data you could send via events (eg. only event_cateogry, label, and value). This made it challenging for higher education marketers to collect data across the whole student journey and analyze in-depth data on the scale.
This has changed, and Events are now the core of Google Analytics 4. But, before going further on events, let’s make sure we understand what an event is and how they work.
An event is an interaction of the user with your Web or Mobile App. All interactions on your website/web such as clicks, visits, downloads, form submissions (leads), student applications [and more] are considered “Events”.
The data model of GA4 offers much more flexibility when it comes to tracking events and sending additional information with it.
In Universal Analytics, you could only send up to 4 event attributes of an event to Google Analytics:
As discussed earlier, everything in GA4 is considered an Event. Depending on your scenario, you can send up to 25 additional parameters with an event without limiting how you name them. For example, let’s say that a future student is reading a program page and decides to fill out a “Request More Information” form. You could send the following event:
The last four parameters on the list above are custom events you can send along with your event, which you can later use to do performance analysis on your Analytics account.
Apart from custom events, GA4 also comes with a set of default events and recommendations for you to follow. Let’s go through them and see how you can utilize them to structure your GA4 configuration better later on.
There are four categories of events in GA4:
Here is how to choose between event categories in GA4:
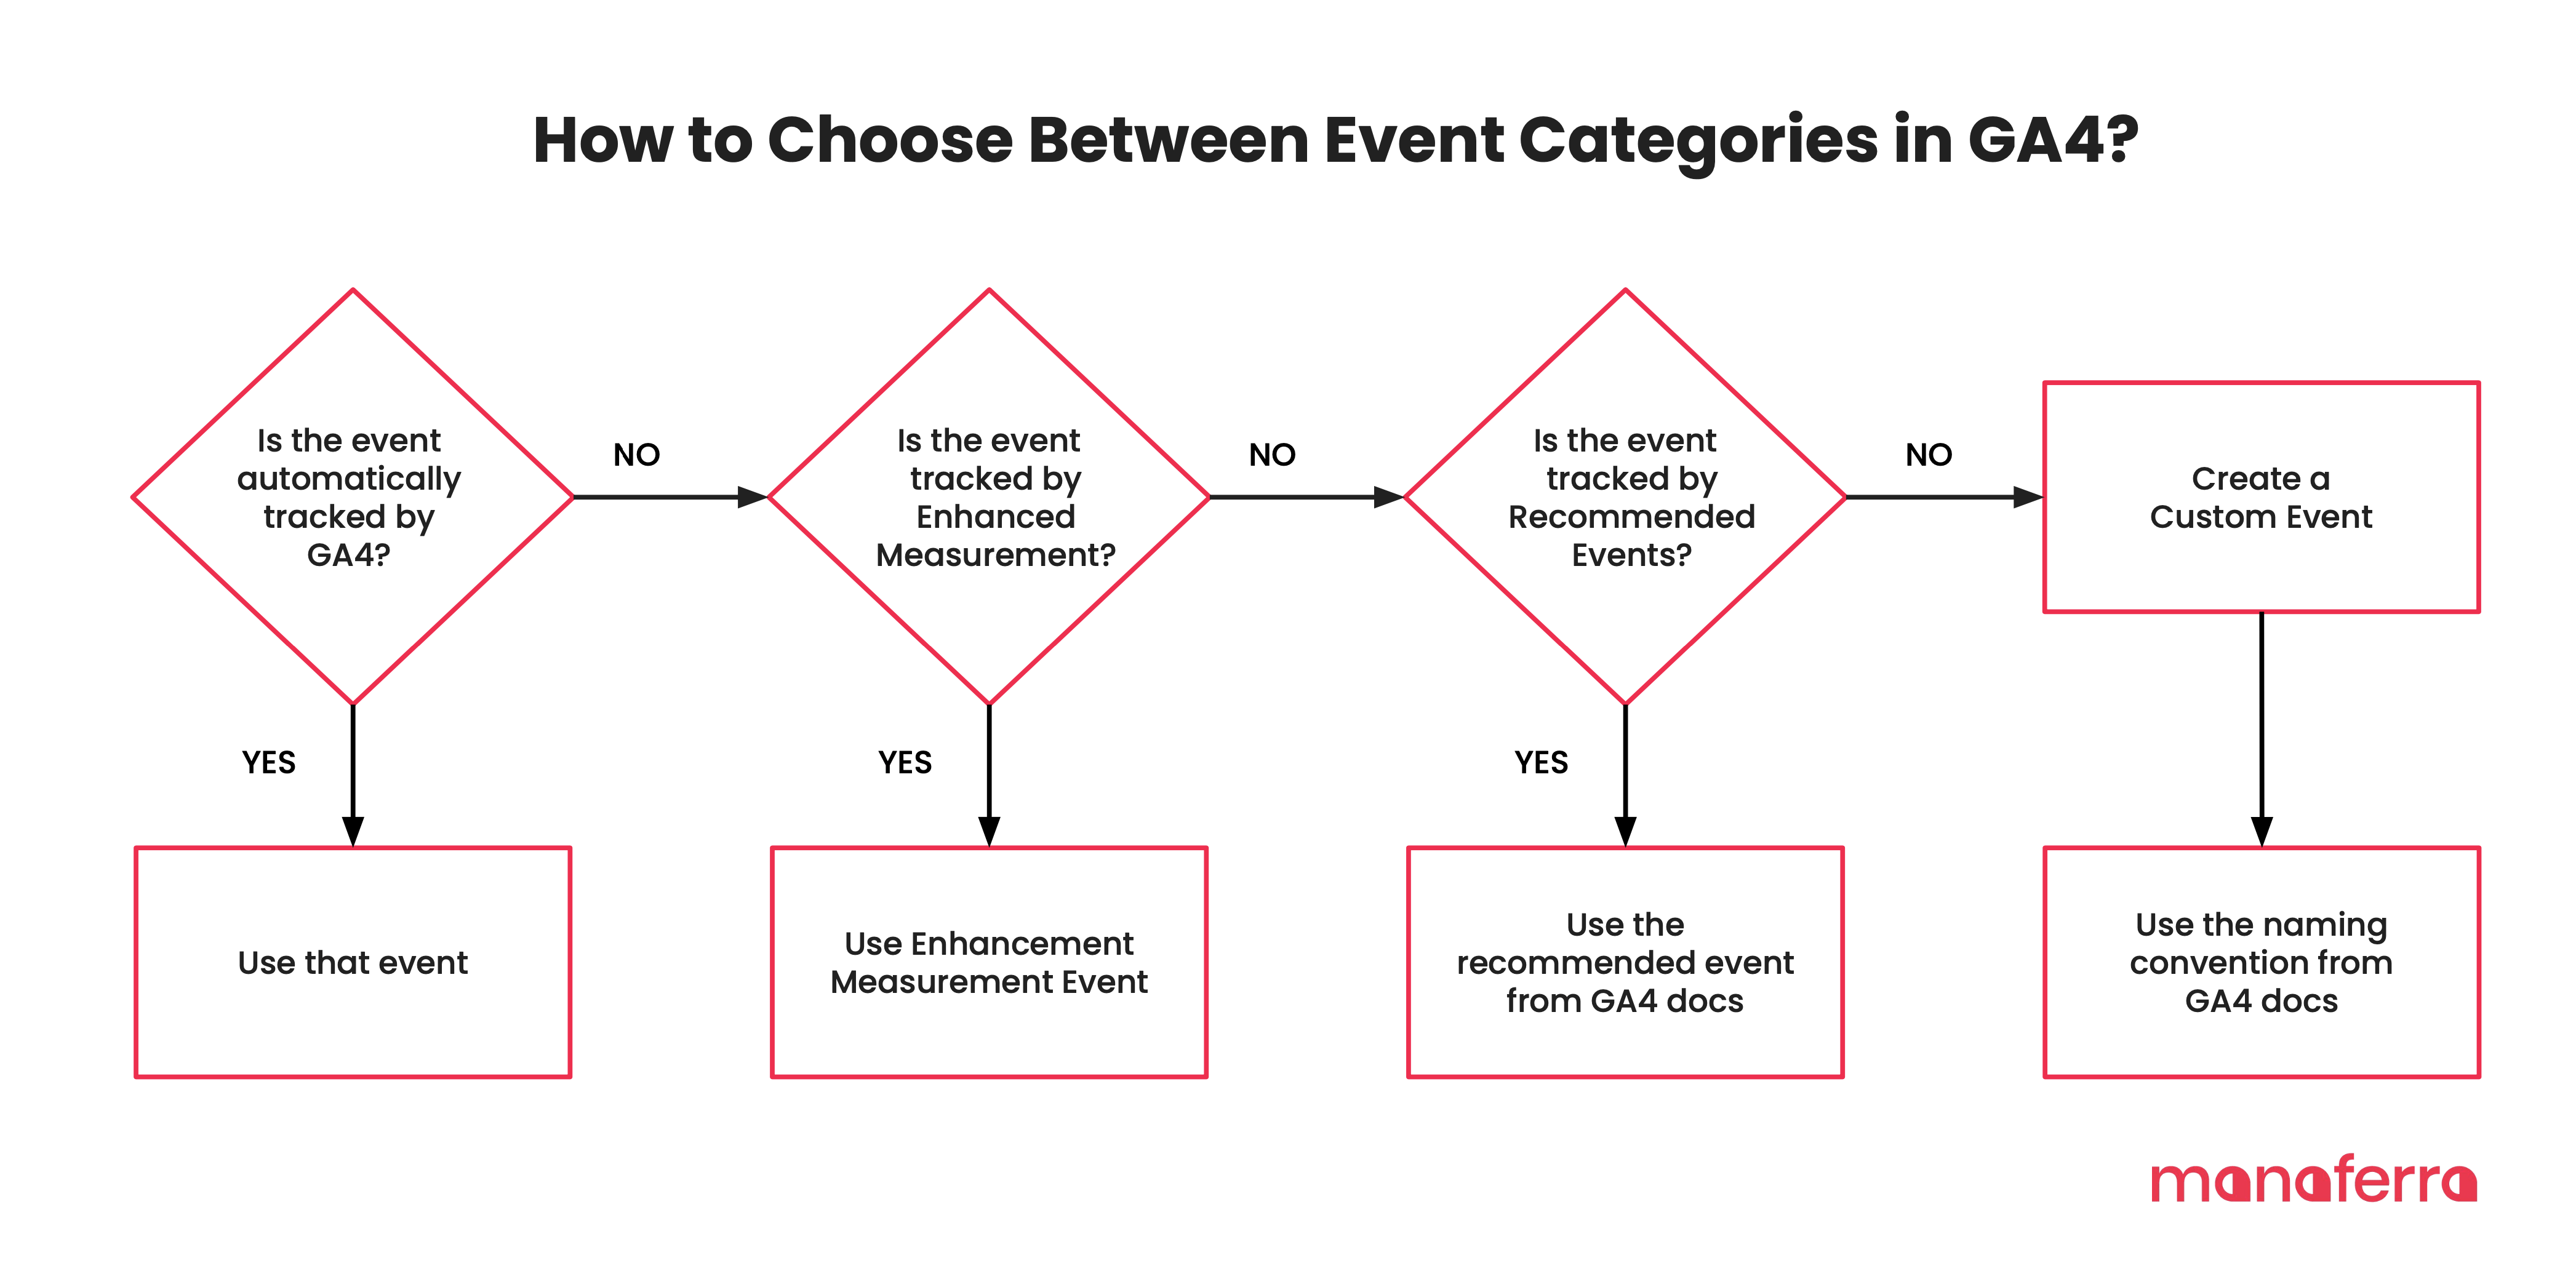
Automatic Events on GA4 include interactions that Google must collect to perform its fundamental analysis on the tool. Those events are automatically triggered by GA4 itself on some predefined user activities. This includes session_start, first_visit, scroll, or user_engagement and other mobile app interactions such as app_update, ad_click, etc. You can get the full list here.
Those are additional automatic events by GA4, with the only difference being that you can enable/disable them on your property level.
You can enable or disable them (they come enabled by default) when you configure your web Data Stream in GA4.
When this feature is enabled, Enhancement Measurement will automatically track the following events:
You can enable or disable each one by clicking the gear button on the right side of the Enhanced Measurement section. Moreover, you can also customize some of them to fit your university website needs.
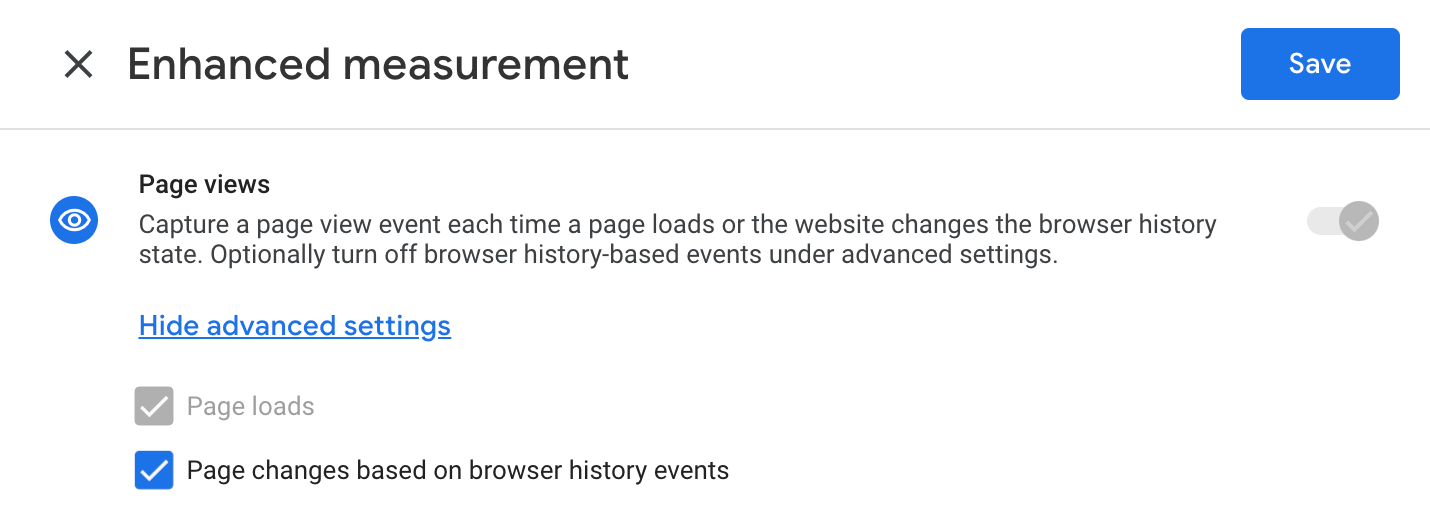
Page views:
This event is sent to GA4 when a new page loads or the URL of the page changes without reloading the page (a.k.a. history change events). Suppose your university website is built on SPA (Single Page Application), where your entire page doesn’t refresh when pages are changed. In that case, you need to ensure that your website is changing pages/URLs and changing the browser’s history events (you might need a developer’s help here).
Scrolls:
GA4 can automatically send events when a visitor scrolls below 90% of the page height. If you need to track scroll on a different scale, you might need to do that via Google Tag Manager manually.
Outbound clicks:
This event is automatically triggered when a user clicks on a link redirecting them to another domain. This is a great feature you can use to see which of the websites you have linked on your website content are helping your students answer their questions.
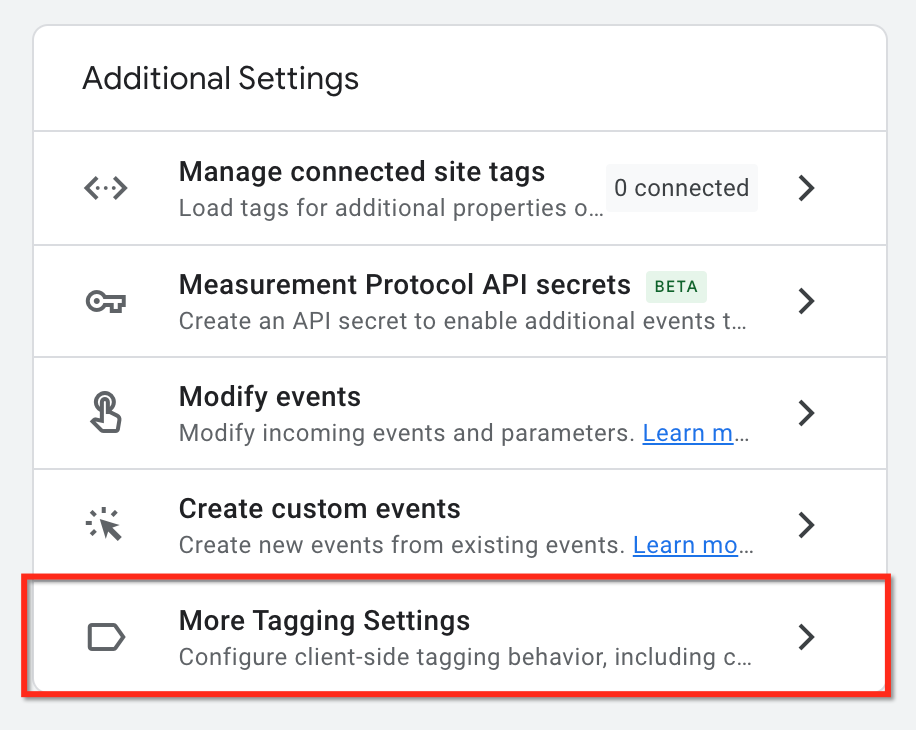
If your university operates in multiple domains, set up cross-domain tracking (via GA4 property > More Tagging Settings > Configure your domains) so clicks on your own domains are now considered outbound/referral links.
Site search:
This event allows you to track searches performed by your current and potential students on your university website. When enabled, it will automatically send a “view_search_results” event to GA4, if the page loads and the URL of the page contains a query parameter, such as q, s, search, query, and keyword.

If you are using WordPress for your website, there is nothing you need to change on the “Search Term Query Parameter” input, as the letter “s” will automatically get the job done. Otherwise, make sure you include your search query parameter on the configuration. For example: if your website search looks like https://www.my-university-webste.com/search?term=tuition-fees, you need to enter the word “term” as an option in the above configuration.
Video engagement:
This is built to track the user’s interaction with Youtube videos on your website. However, due to some technical reasons, this feature will not work by default unless your developer changes how those videos are served.
File downloads:
GA4 can automatically detect the download of files on your website and send an event when your link url contains one of the following extensions: .pdf, .xls, .xlsx, .doc, .docx, .txt, .rtf, .csv, .exe, .key, .pps, .ppt, .pptx, .7z, .pkg, .rar, .gz, .zip, .avi, .mov, .mp4, .mpe, .mpeg, .wmv, .mid, .midi, .mp3, .wav, .wma.
Once you’re done with all of the above configurations, click Save, and your GA4 will automatically start to track those events once you set up the GA4 tag on your website.
Those are events recommended by Google for different business categories but not enabled and configured by default. You will need to follow the recommended naming convention and set them manually on your web/app and Analytics to benefit from additional features Google may introduce to the platform.
If none of these we have previously listed in Automatic and Enhancement events doesn’t fit your needs, then look at the recommended events Google has published in its documentation. For the time being, Higher Education institutions can use the following recommended events based on their needs:
Google recommends that you implement their recommended events when it makes sense for you because it can use those them to better understand your web/app performance during its Machine Learning analysis.
If none of the previously discussed events fit your needs, you can create custom events. They work pretty much as the above events; however, they are some things you need to consider before deciding to use custom events:
For the time being, GA4 does NOT allow you to edit or delete your custom events. So make sure you have a thoughtful events strategy in place before reaching out to the 500 unique event limit
Let’s see how a higher education institution can use custom events to measure its marketing performance.
Before going further, let’s set the table about what a Conversion is for a Higher Education Institution.
A conversion is a significant interaction you want your visitors to complete on your website. That can be a micro-conversion, a Conversion that puts your visitors one step closer to the main (macro) conversion (such as subscribe, download, chat discussion), or a macro conversion, a final conversion on your website (such as leads or student applications).
By tracking these conversions (and others), you are in a better position to measure the performance of your marketing activities and make decisions based on data.
In GA4, you can, for example, create a segment of visitors who have read a page about a certain degree who didn’t request more information and then use custom dimensions to understand their behavior compared to the ones who converted.
Now, In Universal Analytics, you used to track conversions by setting up Goals. You may have had a thank you page for your Request Information Forms and used that page as a trigger to create a goal.
In GA4, all conversions are tracked via Events. So, before a Conversion becomes “a Conversion”, it has to be an Event. You can use a pre-defined conversion event (such as “generate_lead”) or create a custom Event and mark it as a conversion by going to Configure > Events and marking a specific event as Conversion.

Alternatively, you can go to Configure > Conversions, then press the New conversion event button and enter the event’s name, for example, application_submitted.
Once you do that, wait for up to 24 hours, and you will start seeing conversion data in the list of all Conversions.
When it comes to tracking conversions for Universities and Colleges, here is a list of events that we recommend creating and marking as conversions:
The ultimate goal of events is to take action. If you have an event or metric on Google Analytics for which you cannot answer the question, “If I have this information, I could do this” then the chances are that you are using a vanity metric, and you won’t be seeing value out of it.
When it comes to deciding what metrics are essential for your university to track, it might be necessary to take a step back, look at it from a broad marketing and business perspective and ask questions like:
Once you answer these questions, it might be time to start thinking about how you can translate them to concrete actions on Google Analytics. Using a framework like QIA to identify the right metrics for your school can be helpful. Start by asking these three questions:
Let’s take an example of a scenario many higher education marketers face: What is the conversion rate of students for each channel? (Q)
You would need to figure out what information (I) you need to answer that question. In this case, you would need:
Is that information already stored? Do I need to track it and keep it in Google Analytics? If you don’t have funnel conversion tracking set up, for now, you might need to add it to your @todo list.
Great! Now that we know what information we need, let’s decide about the most critical part of the framework: Action (A):
You will need to plan actions based on answers to these questions. For example:
“If the conversion rate from Organic Search is 2% or higher, we’re doing well. If it’s lower than 2%, we’ll re-evaluate funnel pages, the effectiveness of the call-to-action and the SEO strategy to see how we can improve it”.
Answers like this will help you build an action plan with specific actions on implementing this tracking strategy, from defining events to conversion, account setting, and reporting.
Reporting in Google Analytics 3 takes another level due to the flexibility of its data model.
In Universal Analytics, you have had numerous ready-to-use reports that, even though you might have found practical, were very limited in capabilities and pretty much the same for everyone.
While you now have much fewer ready-to-use reports in GA4, its flexibility in adapting and creating advanced custom reporting based on your needs is way beyond what we are used to seeing in the previous version of Analytics.
Reporting in GA4 is divided into two sections, which can be found on the main left navigation

Google offers numerous default reports on GA4 to help you kick off analysis faster. However, to fully utilize the benefits of the tool, you might need to customize such reports based on your use cases and needs.
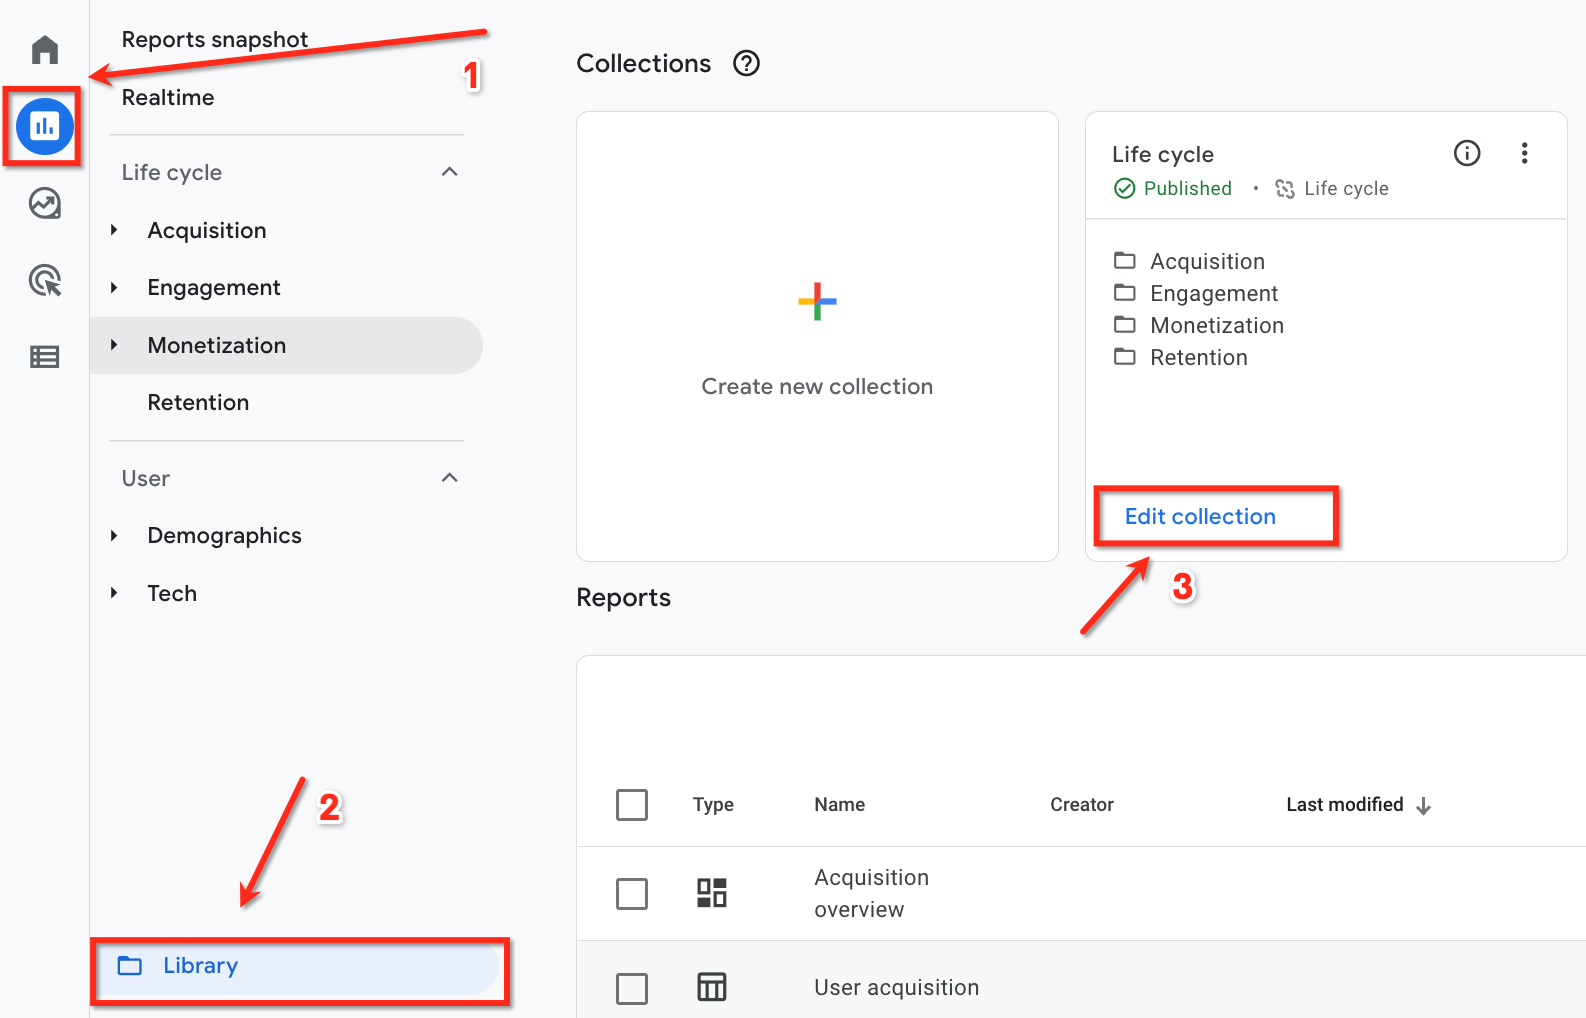
For example, if you do not directly monetize your university website, you don’t need to see the monetization charts on your reports. You can go to Reports > Library > Edit Collection and then remove/add the necessary report from the main navigation.
While on Library, you can add two types of new reports: Overview and Detail Report
Overview report: A dashboard (comprising a set of cards) that summarizes a detailed topic report (A topic can have only one overview report.)
Detail report: This can have up to two visualizations and a table with dimensions and metrics.

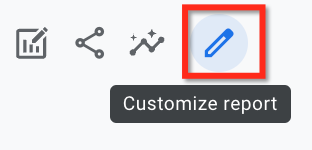
You can also customize individual reports only to show what’s important for your university. You can do that by going to a specific report and clicking on the “Customize reports” icon on the top right side of the page. From there, you can add/remove cards (widgets) and set dimensions/metrics as per your needs.
As you can see, there are certain limitations on the number of widgets, tables, and customizations you can make on default reports, and that’s where custom reports come in.
Exploration is one of the best features of Google Analytics 4. It’s a collection of advanced techniques of analysis that can help your university create advanced reports and reveal deep insights about your future students and their behavior.
You can access exploration reports by going to the main navigation and clicking on Explore. You can create a fully customizable report (if you are short on time or now sure how to start), or you can use built-in templates.

Let’s explore some of the built-in templates, so you can have a better understanding of their benefits.
Free form
Use this template to find out more about your website visitors. You can visualize data in a table or graph format, use multiple dimensions, segments, and metrics, and compare.
Funnel Exploration
This template is pretty helpful for visualizing the steps your students took before converting to a lead or application as part of a pre-defined conversion funnel.
Path exploration
Use this template when you want to discover your students’ interaction toward a conversion. You can also do a reverse analysis and find out what your students do before converting.
Segment Overlap
This template allows you to show and compare the relationship between (up to 3) segments.
The learning curve to creating custom reports may be long for many higher education marketers. However, once you go through built-in templates and do some trial and error, you will start discovering new insights that will lead you toward better decision-making.
Now that you know the main differences between GA3 and GA4, you’re better positioned to migrate your university website from Google Analytics 3 to Google Analytics 4.
GA4 is an entirely different beast from its predecessor. It’s more flexible, more powerful, and more capable of making data-driven decisions. However, it’s not a simple migration process; you need to make sure you are making the right strategic decisions before starting the migration and have all the necessary information to set it up for success.
If you are just starting with GA4 in general and you are not sure where to start or how to properly migrate your university website to GA4, feel free to reach us, and we will be happy to help.
Migrating from Google Universal to Google Analytics 4 is no simple task. Sure, account setup is relatively straightforward, but setting up the proper conversion tracking is much more complicated now. Google Analytics 4 has its advantages and disadvantages, but like all new forced changes, it will take time to get used to. Google Analytics 4 will actually be an improvement on your analytics data as it is based solely on events and parameters.
Let our team of Google Analytics 4 experts do the heavy lifting for you.

CEO, Co-Founder
Faton is the Co-founder & CEO of Manaferra and someone who wakes up every morning seeing endless possibilities to progress and help others make a difference, for the better. That thought then translates everything he does to see both the team and clients move forward.
Faton is the Co-founder & CEO of Manaferra and someone who wakes up every morning seeing endless possibilities to progress and help others make a difference, for the better. That thought then translates everything he does to see both the team and clients move forward.
Stay up to date with the latest marketing, sales, and service tips and news.
READ THE CASE STUDY
